
Introduction
I might stop writing new blogs on this site so please visit dataqoil.com for more cool kinds of stuff.
Visualise Nepal Stock Exchange Data and Deploy it On Heroku Using Streamlit and Plotly.
If you are from Nepal then you already know what Nepal Stock Exchange means. Honestly I don’t know how to describe stock market but after watching movie Pi, I wanted to take a look at NEPSE data by myself. I am not sure about how old data are present on the NEPSE but I think there are data available from 1980. I started to scrap data on 2019 January and it was very difficult task for me to write the right codes. But there are great and kind programmers who shares their great skills on GitHub. So I came across this repository. I started to scrap all the data of past transaction and it was quite frustrating after server hanged up so I found the best way of scrapping is by scrapping data by each year and then write it on CSV file. Please follow this mine repository for more scrapping code but note that We don’t use any of those data so just look that repository for more information only (if available). And rest is on this blog.
Here is a demo Heroku app that we will be building.
Where was I lost?
From nearly a month, I had not written any blogs because we had our huge festival in Nepal, Dashain and Tihar. Also I was playing lots of games like Injustice Gods Among Us. And I have also been busy watching series like Silicon Valley and Mr. Robot. And good news about me must be I have joined NAAMI as Junior Unity Software Developer from last week.
Getting Systems Ready
Of course we need python along with few other libraries. If you are wondering what should be the requirements then please follow the repository and download all the codes then TADAAAAA!!!! But to describe it on steps, please follow below steps:
- Make a virtual environment using venv
- Install below libraries best way to download is using
pip install -r requirements.txt(Assuming that you have downloaded my repository above):beautifulsoup4==4.8.0 numpy==1.17.3 pandas==0.25.1 plotly==4.12.0 requests==2.18.4 requests-oauthlib==1.2.0 requests-toolbelt==0.9.1 retrying==1.3.3 streamlit==0.71.0 urllib3==1.22 uvicorn==0.12.2 matplotlib==3.3.3 html5lib==1.0.1 lxml==4.4.1
Importing Dependencies
Make a python file nepse.py under your project folder.
import streamlit as st
import numpy as np
import pandas as pd
from bs4 import BeautifulSoup as BS
import requests
import urllib3
import time
import matplotlib.pyplot as plt
import plotly.express as px
streamlitis used to make a web app and honestly this is the most easiest, fastest and awesome way of deploying ML APPS.numpyas usual.pandasfor data processing (mostly masking, making dataframes).BeautifulSoup, we can scrap the data from NEPSE’s site.requestsfor making HTTP requests.urllib3for handling HTTP client.timeas usual.matplotlibfor making simple visualization.plotlyfor making cool visualization.
Method: company_names()
As of 2022, some of URLs seems to have changed, thus old lines will be commented out.
import streamlit as st
import numpy as np
import pandas as pd
from bs4 import BeautifulSoup as BS
import requests
import urllib3
import time
import matplotlib.pyplot as plt
import plotly.express as px

def company_names():
    http = urllib3.PoolManager()
    http.addheaders = [('User-agent', 'Mozilla/61.0')]
    # url = "http://www.nepalstock.com.np/company?_limit=500"
    url = "http://www.nepalstock.com/company?_limit=500"
    web_page = http.request('GET', url)
    soup = BS(web_page.data, 'html5lib')
    table = soup.find('table')
    company=[]
    rows = [row.findAll('td') for row in table.findAll('tr')[1:-2]]
    col = 0
    notfirstrun = False
    for row in rows:
        companydata =[]
        for data in row:
            if col == 5 and notfirstrun:
                companydata.append(data.a.get('href').split('/')[-1])
            else:
                companydata.append(data.text.strip())
            col += 1
        company.append(companydata)
        col =0
        notfirstrun = True

    df = pd.DataFrame(company[1:],columns=company[0])
    df.rename(columns={'Operations':'Symbol No'},inplace=True)
    df.index.name = "SN"
    df.drop(columns='',inplace=True)
    df.drop(columns='S.N.',inplace=True)
    return df
company_names()
| Stock Name | Stock Symbol | Sector | Symbol No | |
|---|---|---|---|---|
| SN | ||||
| 0 | 10 % NMB DEBENTURE 2085 | NMBD2085 | Corporate Debenture | 2850 |
| 1 | 10% Himalayan Bank Debenture 2083 | HBLD83 | Corporate Debenture | 2873 |
| 2 | 10% Nabil Debenture 2082 | NBLD82 | Corporate Debenture | 2892 |
| 3 | 10% Nepal SBI Bank Debenture 2086 | SBIBD86 | Corporate Debenture | 2890 |
| 4 | 10% Prabhu Bank Debenture 2084 | PBLD84 | Corporate Debenture | 2904 |
| ... | ... | ... | ... | ... |
| 268 | UNIVERSAL POWER COMPANY LTD | UPCL | Hydro Power | 2810 |
| 269 | Unnati Sahakarya Laghubitta Bittiya Sanstha Li... | USLB | Microfinance | 2774 |
| 270 | Upper Tamakoshi Hydropower Ltd | UPPER | Hydro Power | 2792 |
| 271 | Vijaya laghubitta Bittiya Sanstha Ltd. | VLBS | Microfinance | 687 |
| 272 | Womi Microfinance Bittiya Sanstha Ltd. | WOMI | Microfinance | 706 |
273 rows × 4 columns
This method is used to get list of company names.
- Create a HTTP client and make a GET request.
- Find the table of result from http://www.nepalstock.com.np/company?_limit=500
- Do some cleaning to get the company data for each company and make a DataFrame for it.
After calling the method above, a dataframe just like above must be shown. It is clear that there are 273 companies. We will be using columns like Stock Symbol and Symbol No.
Visualising Only Limited Data on Streamlit
Why to show entire dataframe on webapp while we can show only desired? So we will be using iloc on dataframe i.e. slicing on index.
@st.cache(suppress_st_warning=True)
def load_data():
# data = pd.read_csv(DATA_URL, nrows=nrows)
data = company_names()
lowercase = lambda x: str(x).lower()
data.rename(lowercase, axis='columns', inplace=True)
return data
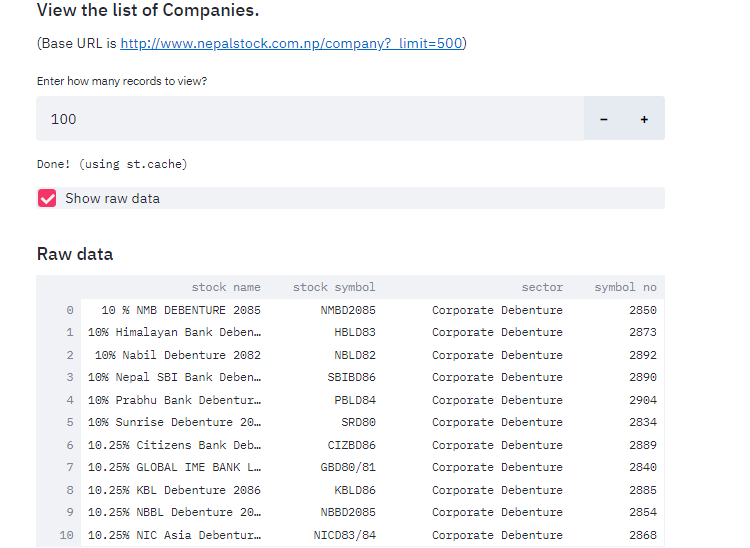
st.subheader("View the list of Companies.")
def view_company_names():
st.markdown("(Base URL is [http://www.nepalstock.com.np/company?_limit=500](http://www.nepalstock.com.np/company?_limit=500))")
num = st.number_input("Enter how many records to view?", min_value=1, max_value=None, step=1)
data_load_state = st.text('Loading data...')
data = load_data()
data_load_state.text("Done! (using st.cache)")
if st.checkbox('Show raw data'):
st.subheader('Raw data')
st.write(data.iloc[:num])
return data
cdf = view_company_names()
2 methods are given above.
Method: load_data()
This method uses the decorator cache to store data in cache and to ignore the cache warning, suppress_st_warning=True is used. This method calls the method comapny_names() and gets the dataframe then makes all the column name to lowercase and then returns that dataframe.
Method: view_company_names()
This method is for visualizing actual data. It allows us to input the number and then the dataframe is sliced up to that index.
- Streamlit allows us to take number input using
number_input()method. - streamlit allows us to show text usign
text()method. - Then we load our data from previous method and then after data has been loaded, show log like text.
- streamlit allows us to use checkbox using
checkbox()then if it is ticked then show data up to the number user has entered. - Also return the original data because it will be used later.
Now save the code above and then from terminal opening on same directory as this file(assume that file name is neplse.py), do
streamlit run nepse.py
If everything is okay then streamlit will provide us a local link with unique port number. By clicking it, we can visualize our first ever NEPSE data visualizer. It should look like below.
View Company Details
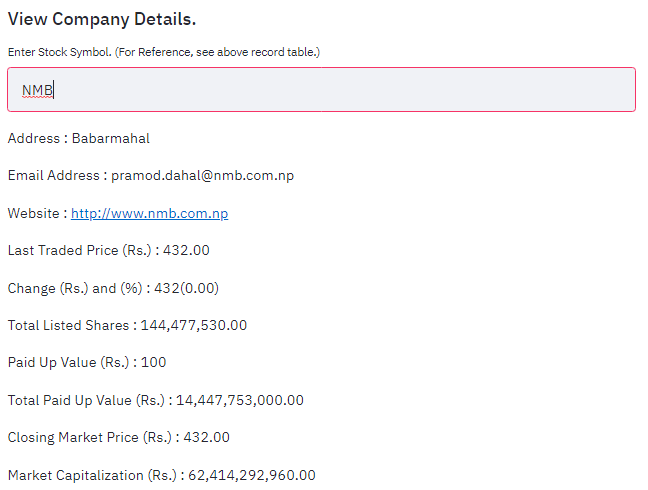
st.subheader("View Company Details.")
def view_company_details():
    symbol = st.text_input("Enter Stock Symbol. (For Reference, see above record table.)")
    symbol_no = None
    if len(symbol)>=2:
        url = "http://www.nepalstock.com/company/"

        try:
            req = requests.post(url, data={"stock_symbol":symbol}, verify=False)
            symbol_no = cdf[cdf["stock symbol"]==symbol]["symbol no"]
        except requests.exceptions.RequestException as e:
            print(e)

        response = req.text
        soup = BS(response, "lxml")
        table = soup.find("table")

        for row in table.findAll("tr")[4:]:
            col = row.findAll("td")
            st.write(col[0].string,": ",col[1].string)

    return symbol_no

symbol_no = view_company_details()
if  symbol_no is not None:
    symbol_no = symbol_no.tolist()[0]
The method above is used to visualize the company details.
- Ask user for the Stock Symbol (ex NMB, ADBL etc).
- Same as earlier method, it makes post request to url http://www.nepalstock.com/company/ and then uses that result to view details.
- If the Stock Symbol matches then get symbol number assigned to it. Then do some data cleaning and visualize the result by
st.write() - Return the Symbol Number.
The result must be something like below.
Visualize Data of some time period
First we need to get that data. As I stated earlier, sometimes scraping data of entire history will not be feasible and last time I tried that, my laptop crashed so scrapping part by part will be great idea.
Method: CompanyStocksTransactions()
- Make a GET request to http://www.nepalstock.com.np/company/transactions/%s/0/?startDate=%s&endDate=%s&_limit=9000000 by providing start and end date in required field.
- Then as previous methods, clean the data and make a dataframe.
- Return that dataframe.
Method: view_by_year()
- Method takes start date, end date and symbol number of that company symbol.
- Call the method
CompanyStocksTransactionsto get dataframe within that date. - Return that dataframe.
Before calling methods, we try to get date from the streamlit’s date_input method and then pass that date to view_by_year method. Also make a checkbox whether to see raw dataframe or not.
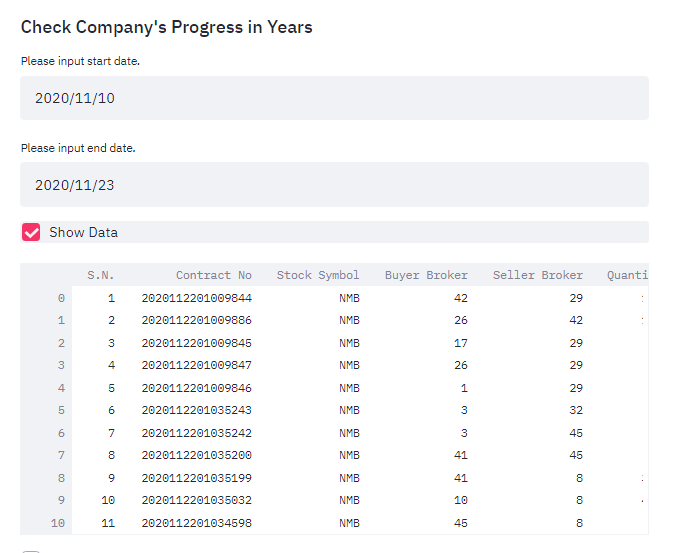
st.subheader("Check Company's Progress in Years")
def CompanyStocksTransactions(SymbolNo,startDate, endDate):
    # url="http://www.nepalstock.com.np/company/transactions/%s/0/?startDate=%s&endDate=%s&_limit=9000000"%(SymbolNo,startDate, endDate)
    url="http://www.nepalstock.com/company/transactions/%s/0/?startDate=%s&endDate=%s&_limit=9000000"%(SymbolNo,startDate, endDate)
    #print("Connecting to %s "%url)
    http = urllib3.PoolManager()
    http.addheaders = [('User-agent', 'Mozilla/61.0')]
    web_page = http.request('GET',url)
    #print("Adding to DataFrame")
    soup = BS(web_page.data, 'html5lib')
    table = soup.find('table')
    FloorSheet=[]
    rows = [row.findAll('td') for row in table.findAll('tr')[1:-2]]
    for row in rows:
          FloorSheet.append([data.text.strip() for data in row])
    if(len(FloorSheet) != 0):
          FloorSheetdf = pd.DataFrame(FloorSheet[1:],columns=FloorSheet[0])
          FloorSheetdf['Date']=pd.to_datetime(FloorSheetdf['Contract No'], format='%Y%m%d%H%M%f', errors='ignore')
          return (1, FloorSheetdf)
    else:
          return (0, None)

@st.cache(suppress_st_warning=True)
def view_by_year(start_date="2020-1-1", end_date="2020-1-2", symbol="2810"):
    st.write("From year %s to %s "%(start_date, end_date))

    success, dftest=CompanyStocksTransactions(symbol, start_date, end_date)
    if success==1:
        st.write("Successfully scrapped data. Showing results.")
        # st.write(dftest)
    else:
        st.write("Can't scrap data. Try using another symbol. Or Another date.")
    return dftest
start_date = st.date_input("Please input start date.")
end_date = st.date_input("Please input end date.", min_value=start_date)
dfyear = view_by_year(start_date=str(start_date), end_date=str(end_date), symbol=symbol_no)
show_df = st.checkbox("Show Data")

if show_df:
    st.write(dfyear)
The result must be like below:
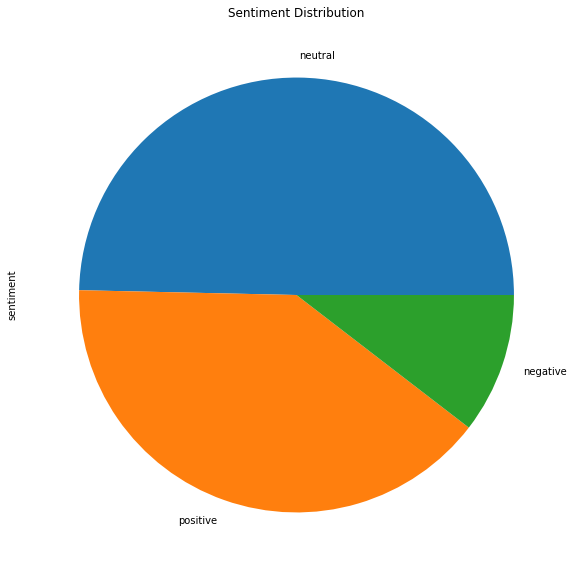
Do Real Visualization
Now is the time for doing visualization of our time series data. We have already scrapped the data of our interest now is the time to use image to tell story.
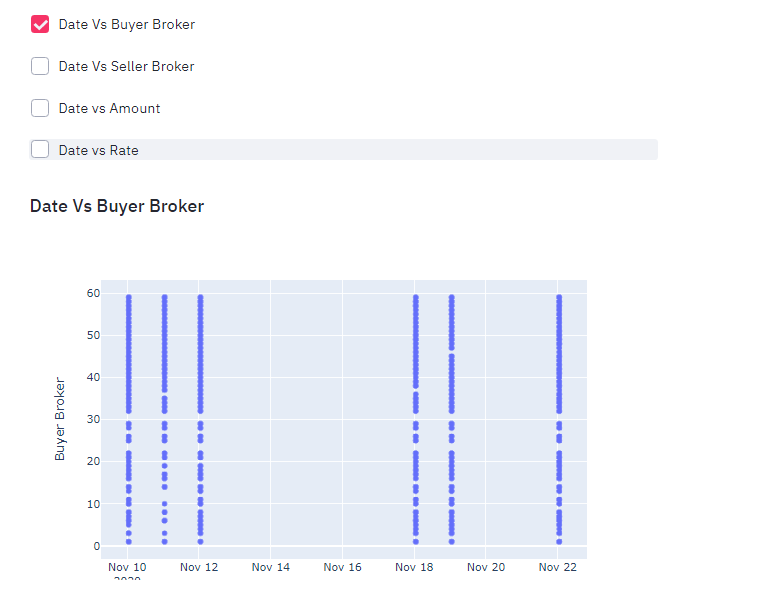
- Prepare the checkboxes to visualize data.
- Date vs Buyer Broker
- Date vs Seller Broker
- Date vs Amount
- Date vs Rate
date_vs_bbroker = st.checkbox("Date Vs Buyer Broker")
date_vs_sbroker = st.checkbox("Date Vs Seller Broker")
date_vs_amount = st.checkbox("Date vs Amount")
date_vs_rate = st.checkbox("Date vs Rate")

def visualise_broker():
    if date_vs_bbroker:
        st.subheader("Date Vs Buyer Broker")
        fig = px.scatter(dfyear, x="Date", y="Buyer Broker")
        st.plotly_chart(fig)

    if date_vs_amount:
        st.subheader("Date Vs Amount")
        fig = px.scatter(dfyear, x="Date", y="Amount")
        st.plotly_chart(fig)

    if date_vs_sbroker:
        st.subheader("Date Vs Seller Broker")
        fig = px.scatter(dfyear, x="Date", y="Seller Broker")
        st.plotly_chart(fig)

    if date_vs_rate:
        st.subheader("Date Vs Rate")
        fig = px.scatter(dfyear, x="Date", y="Rate")
        st.plotly_chart(fig)

visualise_broker()
- Use plotly to scatter our data by giving dataframe and then x and y axis.
- Use the figure made by plotly to view it on web app using streamlit’s
plotly_chart.
Our result must be like below.
If you have came this far then congratulations, you have just made your streamlit app to visualize NEPSE data. Now is the time to make it live on Heroku.
To deploy it on Heroku, we need to have a Heroku Account. Please make one. After making an account, make a new heroku app from here. Give it a proper name.
Preparing additional files
Assume that your main file name is nepse.py. I am not going to explain in detail but if you are concerned then please follow this blog where i have written about deploying Face Mask Classifier on Heroku. Additional files required are:
- requirements.txt: Using
pip freeze > requirements.txt - Procfile: Process file.
web: sh setup.sh && streamlit run nepse.py - setup.sh: Setup file.
  mkdir -p ~/.streamlit

  echo "[server]
  headless = true
  port = $PORT
  enableCORS = false
  " > ~/.streamlit/config.toml
After making all files then make one Git repository and push all the changes to it because we will be integrating our repository to Heroku and Heroku itself will process our files but beware of free version because we have limited number of build number available.
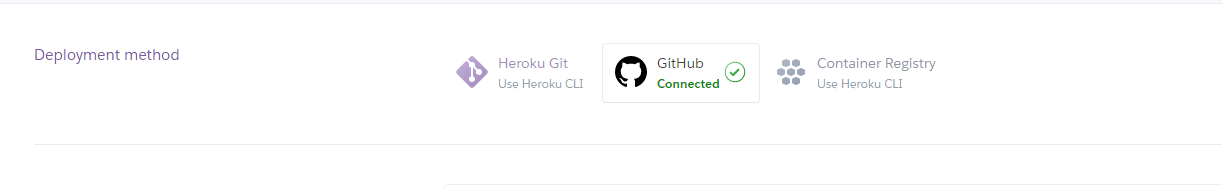
-
Make sure you are selecting GitHub on Deployement Method.
-
Then select the repository you are using to visualize on App Connected to GitHub.
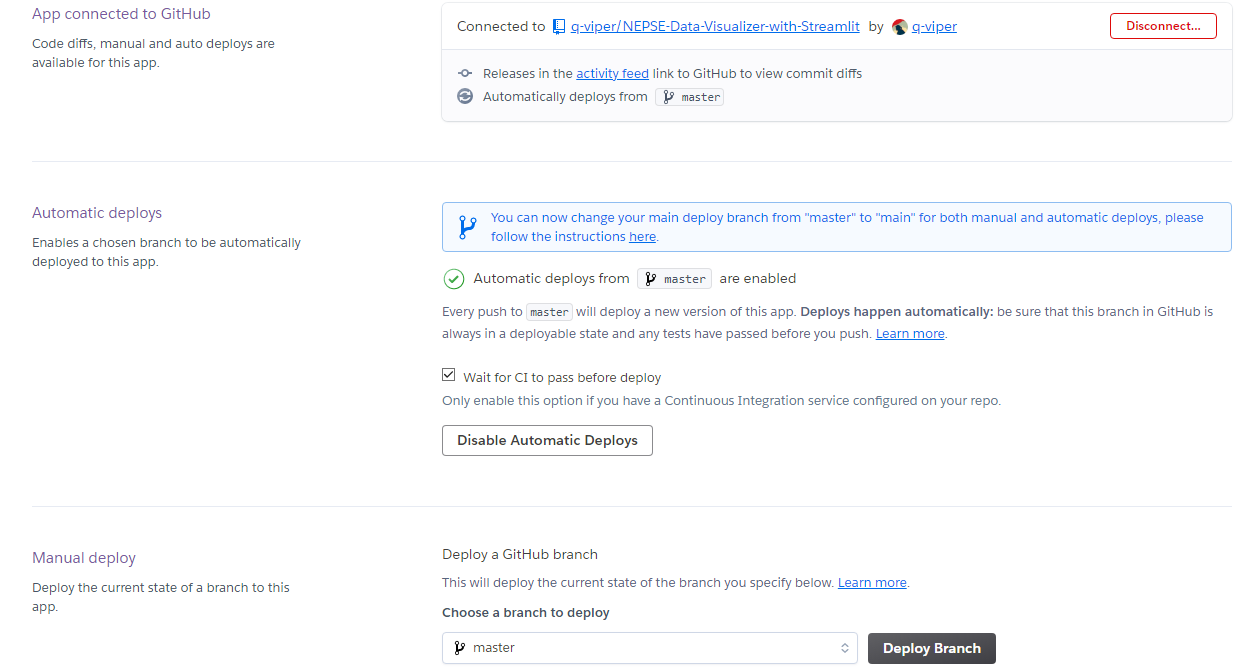
- Chose the right branch.
- If you want automatic deploys, i.e re deploy whenever changes found. Using manual deploy will be best for free version.
- Click on Deploy Branch and let it finish the install dependencies and then after completing run launch the app.
- If error occurs please let me know on comment section.
Finally
Thank you so much for reading my blog and I really hope that this blog has been some help for you too. I am always eager to meet awesome people like you so please find me on Twitter as QuassarianViper and LinkedIn as Ramkrishna Acharya.
Why not read more?
- Gesture Based Visually Writing System Using OpenCV and Python
- Gesture Based Visually Writing System: Adding Visual User Interface
- Gesture Based Visually Writing System: Adding Virtual Animationn, New Mode and New VUI
- Gesture Based Visually Writing System: Add Slider, More Colors and Optimized OOP code
- Gesture Based Visually Writing System: A Web App
- Contour Based Game: Break The Bricks
- Linear Regression from Scratch
- Writing Popular ML Optimizers from Scratch
- Feed Forward Neural Network from Scratch
- Convolutional Neural Networks from Scratch
- Writing a Simple Image Processing Class from Scratch
- Deploying a RASA Chatbot on Android using Unity3d
- Naive Bayes for text classifications: Scratch to Framework
- Simple OCR for Devanagari Handwritten Text


Comments