Drawing Simple Geometrical Shapes on Python Using NumPy and Visualize It
Contents
- What will I do here?
- Circle
- Rectangle
- Compare with OpenCV
- Ellipse
- Compare it with OpenCV’s Ellipse
- Finally
- Bonus Topic
- What next?
Drawing Simple Geometrical Shapes on Python from scratch, have you tried it?
Now in this series of tasks, I am going to tackle some of the interesting image processing concepts from scratch using Python and then will compare them with the popular OpenCV framework. Last time I did Convolution operations from Scratch and RGB to GrayScale conversion, etc. Now is the time to start drawing simple geometrical shapes on python like circles, rectangles, ellipses and get the flashback of childhood. I am highly inspired by the book named Image Operators: Image Processing in Python by Jason M. Kinser. In fact I am going to use some simple geometrical concepts to draw these basic shapes using only NumPy and Matplotlib.
Also, I have to mention the awesome book named The Journey of X: A Guided Tour of Mathematics by Steven Strogatz. Author really has a great way of describing the mathematical terms and I have learned a lot of concepts on Mathematics from there. And the author also introduced the awesome book The Housekeeper and the Professor.
The method I am including here will be added to the previous Image Processing Class (which is also given below) I have used to do Convolution and Colorspace changes. So it will be helpful to view that one also.
What will I do here?
- Using primary-grade mathematics, I will start drawing simple geometrical shapes on python and compare them with OpenCV’s own methods.
import imageio
import warnings
import numpy as np
import matplotlib.pyplot as plt
import cv2
%matplotlib inline
class ImageProcessing:
def __init__(self):
self.readmode = {1 : "RGB", 0 : "Grayscale"}
def read_image(self, location = "", mode = 1):
"""
Uses imageio on back.
* location: Directory of image file.
* mode: Image readmode{1 : RGB, 0 : Grayscale}.
"""
img = imageio.imread(location)
if mode == 1:
img = img
elif mode == 0:
img = self.convert_color(img, 0)
elif mode == 2:
pass
else:
raise ValueError(f"Readmode not understood. Choose from {self.readmode}.")
return img
def show(self, image, figsize=(5, 5)):
"""
Uses Matplotlib.pyplot.
* image: A image to be shown.
* figsize: How big image to show. From plt.figure()
"""
fig = plt.figure(figsize=figsize)
im = image
plt.imshow(im, cmap='gray')
plt.show()
def convert_color(self, img, to=0):
if to==0:
return 0.21 * img[:,:,0] + 0.72 * img[:,:,1] + 0.07 * img[:,:,2]
else:
raise ValueError("Color conversion can not understood.")
def convolve(self, image, kernel = None, padding = "zero", stride=(1, 1), show=False, bias = 0):
"""
* image: A image to be convolved.
* kernel: A filter/window of odd shape for convolution. Used Sobel(3, 3) default.
* padding: Border operation. Available from zero, same, none.
* stride: How frequently do convolution?
"""
if len(image.shape) > 3:
raise ValueError("Only 2 and 3 channel image supported.")
if type(kernel) == type(None):
warnings.warn("No kernel provided, trying to apply Sobel(3, 3).")
kernel = np.array([[-1, 0, 1],
[-1, 0, 1],
[-1, 0, 1]])
kernel += kernel.T
kshape = kernel.shape
if kshape[0] % 2 != 1 or kshape[1] % 2 != 1:
raise ValueError("Please provide odd length of 2d kernel.")
if type(stride) == int:
stride = (stride, stride)
shape = image.shape
if padding == "zero":
zeros_h = np.zeros(shape[1]).reshape(-1, shape[1])
zeros_v = np.zeros(shape[0]+2).reshape(shape[0]+2, -1)
#zero padding
padded_img = np.vstack((zeros_h, image, zeros_h)) # add rows
# print(padded_img)
padded_img = np.hstack((zeros_v, padded_img, zeros_v)) # add cols
image = padded_img
shape = image.shape
elif padding == "same":
h1 = image[0].reshape(-1, shape[1])
h2 = image[-1].reshape(-1, shape[1])
#zero padding
padded_img = np.vstack((h1, image, h2)) # add rows
v1 = padded_img[:, 0].reshape(padded_img.shape[0], -1)
v2 = padded_img[:, -1].reshape(padded_img.shape[0], -1)
padded_img = np.hstack((v1, padded_img, v2)) # add cols
image = padded_img
shape = image.shape
elif padding == None:
pass
rv = 0
cimg = []
for r in range(kshape[0], shape[0]+1, stride[0]):
cv = 0
for c in range(kshape[1], shape[1]+1, stride[1]):
chunk = image[rv:r, cv:c]
soma = (np.multiply(chunk, kernel)+bias).sum()
try:
chunk = int(soma)
except:
chunk = int(0)
if chunk < 0:
chunk = 0
if chunk > 255:
chunk = 255
cimg.append(chunk)
cv+=stride[1]
rv+=stride[0]
cimg = np.array(cimg, dtype=np.uint8).reshape(int(rv/stride[0]), int(cv/stride[1]))
if show:
print(f"Image convolved with \nKernel:{kernel}, \nPadding: {padding}, \nStride: {stride}")
return cimg
ip = ImageProcessing()
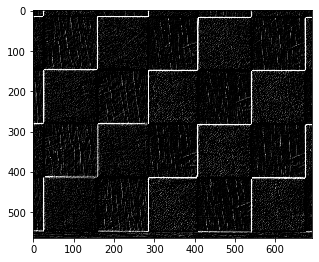
img = ip.read_image("../cb.jpg", mode=0)
cv = ip.convolve(img)
ip.show(cv)
C:\ProgramData\Anaconda3\lib\site-packages\ipykernel_launcher.py:52: UserWarning: No kernel provided, trying to apply Sobel(3, 3).

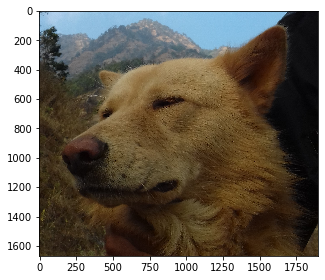
# lets read our new image that we are going to use for drawing simple shape
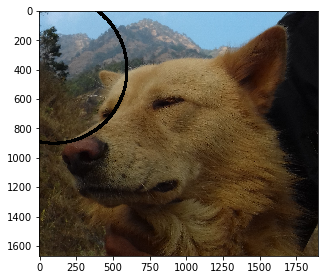
img = ip.read_image("../dog.jpg")
ip.show(img)
Circle
Now onto the first shape on Drawing Simple Geometrical Shapes on Python. Does everyone know what a circle is but only a few care how it originated? Thanks to Euclid and his contribution to modern Mathematics. A circle in the simple term can be thought of as a shape where infinite points are present and the distance between two consecutive points is infinitesimally small and points are arranged at an angle where consecutive points will be near 0 to 360 angle. Computer Graphics doesn’t care about what it needs is a number. So if we zoom the shapes we start to see the pixels crystal clear. Here I will be using the simple concept of drawing a circle. I will be using the concept of polar form. If I have to write it in steps then:-
- Read an input image, get a radius for a circle, get a center point, get a border, get a smoothness value and get a color value for it.
- Prepare smoothness * 360 angles for the circle (of course 0 to 360).
- For each angle:
- Convert angle to radian from degree (NumPy geometric functions take radian).
- Find the distance between two points on the circumference by Pythagoras’ theorem.
- Find the new point on the circumference and make that point’s color on the circle color if the point is on the first quadrant.
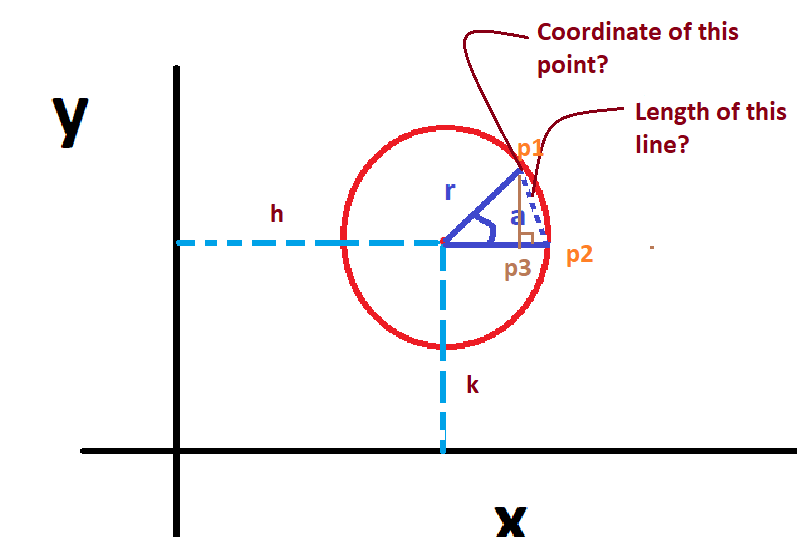
Let’s take an example of the above circle on the 2d plane. Circle’s center is on (h, k) its radius is r, and there are 2 points on circumference p1, p2, and the third point is drawn on the radius line joining p2 and center. Additionally, p3 is perpendicular to the line joining p2 and the center. Here we know the length of 2 lines but not the line p1p3. But when the points p1 and p2 are so near that the distance between them is nearly zero (or the limit tends to 0) then the point p3 will be at p2. At that time we can apply Pythagoras’ theorem. The below figure shows a zoomed version of that situation.
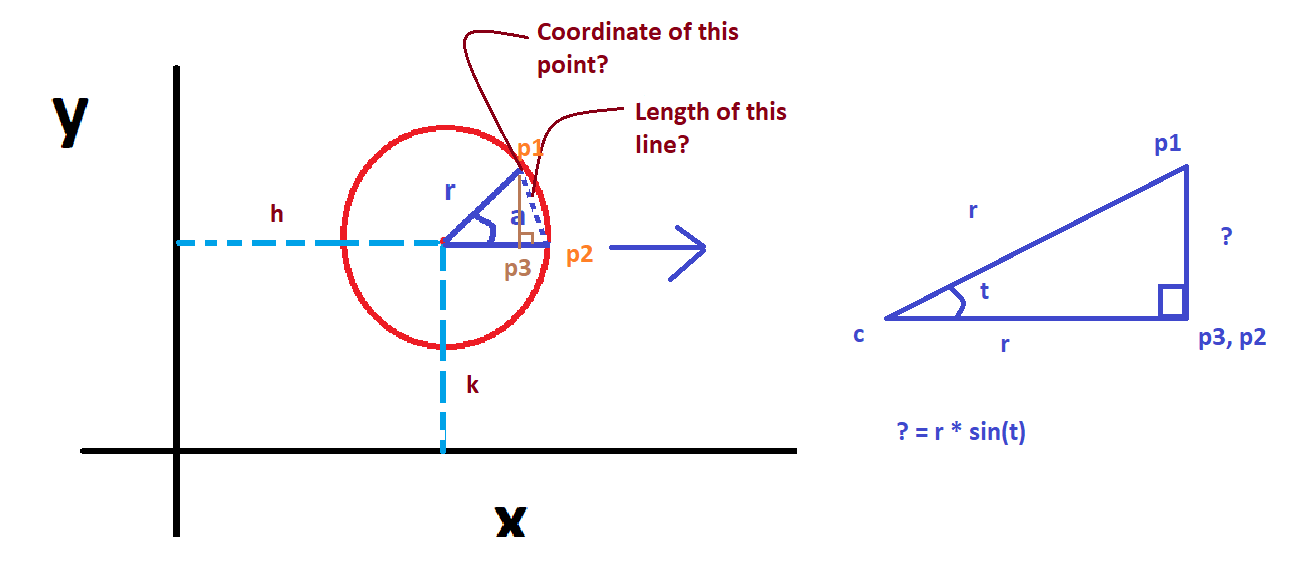
But what we need is the coordinate values of p1. We can do that by thinking that c is the origin. then the x coordinate of p1 will be equal to the x coordinate of p3. And to find the x-coordinate of p3 we can solve it.
Similarly,
\[sin(\theta) = \frac{p}{h}\\ y = p = sin(\theta) * h\]And in our case, when the circle is not in the center then our (x, y) coordinate or p1 will be (h, k) far from the plane’s center.
Hence, the coordinate value for p1 will be:
And on the image plane, the coordinate starts from (0, 0) and we don’t have a -ve quadrant. Hence we ignore all (x, y) values that lie other than the first quadrant. Enough of this theory, let’s write that in code.
All the stories given above are already found in the polar form.
\[x = cos(\theta) * r\\ y = sin(\theta) * r\\ and,\\ r = \sqrt{x^2 + y^2}\\ and,\\ \theta = tan^{-1}(\frac{y}{x})\]# creating a circle
def circle(img=None, center=(0, 0), rad=10, border=4, color=[1], smooth=2):
"""
A method to create a circle on a give image.
img: Expects numpy ndarray of image.
center: center of a circle
rad: radius of a circle
border: border of the circle, if -ve, circle is filled
color: color for circle
smooth: how smooth should our circle be?(smooth * 360 angles in 0 to 360)
"""
if type(img) == None:
raise ValueError("Image can not be None. Provide numpy array instead.")
ix = center[0]+rad
angles = 360
cvalue = np.array(color)
if type(img) != type(None):
shape = img.shape
if len(shape) == 3:
row, col, channels = shape
else:
row, col = shape
channels = 1
angles = np.linspace(0, 360, 360*smooth)
for i in angles:
a = i*np.pi/180
y = center[1]+rad*np.sin(a) # it is p=h*sin(theta)
x = center[0]+rad*np.cos(a)
# since we are wroking on image, coordinate starts from (0, 0) onwards and we have to ignore -ve values
if border >= 0:
b = int(np.ceil(border/2))
x1 = np.clip(x-b, 0, shape[0]).astype(np.int32)
y1 = np.clip(y-b, 0, shape[1]).astype(np.int32)
x2 = np.clip(x+b, 0, shape[0]).astype(np.int32)
y2 = np.clip(y+b, 0, shape[1]).astype(np.int32)
img[x1:x2, y1:y2] = cvalue
else:
x = np.clip(x, 0, shape[0])
y = np.clip(y, 0, shape[1])
r, c = int(x), int(y)
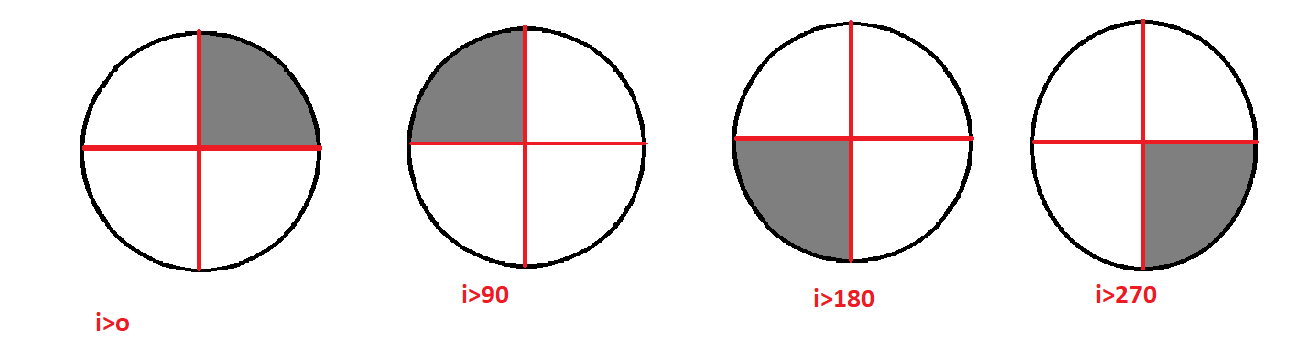
if i > 270:
img[center[0]:r, c:center[1]] = cvalue
elif i > 180:
img[r:center[0], c:center[1]] = cvalue
elif i > 90:
img[r:center[0], center[1]:c] = cvalue
elif i > 0:
img[center[0]:r, center[1]:c] = cvalue
return img
img = ip.read_image("../dog.jpg")
#ip.show(img)
fig = plt.figure(figsize=(5,5))
mimg = circle(img, center=(400, 100), border=20, rad=500)
ip.show(mimg)
<Figure size 360x360 with 0 Axes>
Let me explain a little bit about the code above.
- Check the inputs and loop for the angles.
- We will try to take as many angles as possible given the smoothness value.
- Take a coordinate value for a point to draw on.
- If the point lies on the first quadrant:
- If the order value is +ve then draw only within the pixel and border/2 neighbor pixels on each of 4 directions.
- Else:
- If the angle is greater than 270 then fill the 4th quadrant with color
- If the angle is greater than 190 then fill the 3rd quadrant with color
- If the angle is greater than 90 then fill the 2nd quadrant with color
- If the angle is greater than 0 then fill 1st quadrant with color
Compare it with OpenCV’s Circle
Before comparing with OpenCV, let’s have a clear understanding of the 2d graph plane and the image plane. The image plane starts from the top left side but the 2d graph plane starts from the center upwards. Hence in order to compare our circle, we have to change the center value (in this case).
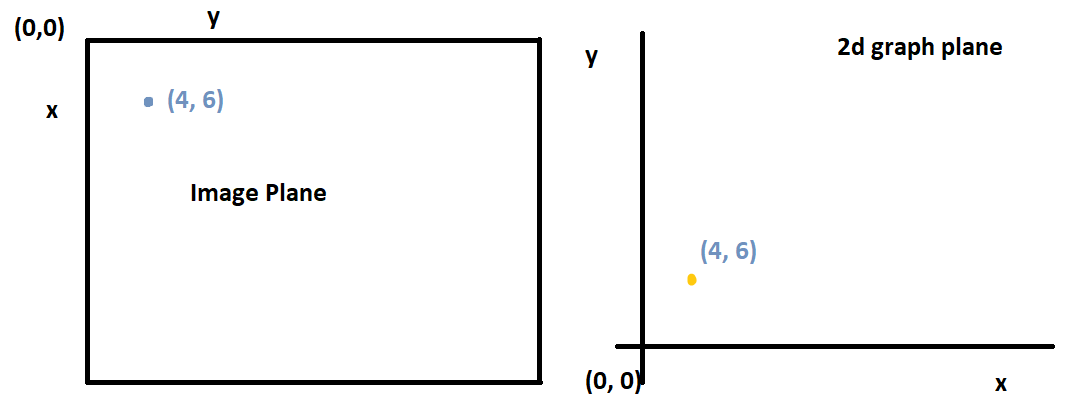
And in this case, I am just swapping center values (i.e. (x, y) for OpenCV and (y, x) for ours).
- Draw circle on the image using OpenCV
- Draw a circle on the same image using our method.
- Subtract drawn images
- Show the difference.
The common parts of images are shown in complete black and those which are not are shown in completely white.
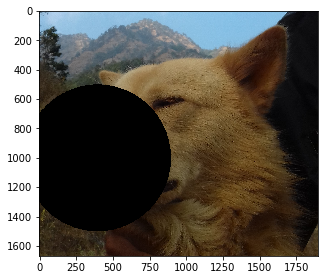
# read image
img = ip.read_image("../dog.jpg")
# draw using opencv
print("OpenCV")
cimg = cv2.circle(img.copy(), (400, 1000), 500, [0, 0, 0], -20)
ip.show(cimg)
# draw using our method (swap center)
print("Ours")
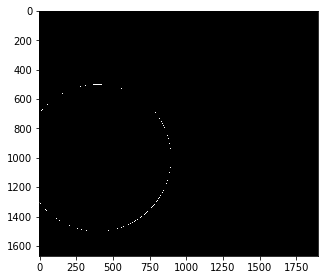
mimg = circle(img, center=(1000, 400), border=-20, rad=500, color=[0, 0, 0])
ip.show(mimg)
# difference
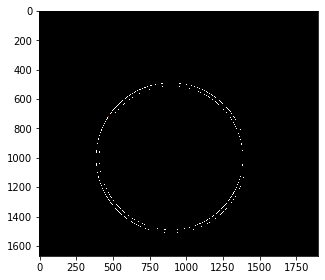
print("Difference")
r = mimg-cimg
r[r!=[0, 0, 0]] = 255
ip.show(r)
# count difference pixels
diff = np.sum(mimg!=cimg)
shape = mimg.shape
# what percentage is different?
diff * 100 / (shape[0] * shape[1])
OpenCV

Ours
Difference
0.2912136361400096
It seems clear that only 0.29% of pixels were different from the result of OpenCV’s circle. But the difference varies with the shape of a circle.
# read image
img = ip.read_image("../dog.jpg")
# draw using opencv
print("OpenCV")
cimg = cv2.circle(img.copy(), (900, 1000), 500, [0, 0, 0], 20)
ip.show(cimg)

# draw using our method (swap center)
print("Ours")
mimg = circle(img.copy(), center=(1000, 900), border=20, rad=500, color=[0, 0, 0])
ip.show(mimg)

# difference
print("Difference")
r = mimg-cimg
r[r!=[0, 0, 0]] = 255
ip.show(r)

# count difference pixels
diff = np.sum(mimg!=cimg)
shape = mimg.shape

# what percentage is different?
diff * 100 / (shape[0] * shape[1])
OpenCV

Ours

Difference
1.064850381662056
Rectangle
Now onto the second shape on Drawing Simple Geometrical Shapes on Python. In drawing simple geometrical shapes on python, Drawing a Rectangle is very easy, in fact, just an array indexing completes the task. We need coordinates of two opposite corners i.e. major diagonal. The top left and bottom right corner coordinate is required in this case. And we will perform array indexing. Same as in the above case, we will work with border and color values.
def rectangle(img, pt1, pt2, border=2, color=[0]):
"""
img: Input image where we want to draw rectangle:
pt1: top left point (y, x)
pt2: bottom right point
border: border of line
color: color of rectangle line,
returns new image with rectangle.
"""
p1 = pt1
pt1 = (p1[1], p1[0])
p2 = pt2
pt2 = (p2[1], p2[0])
b = int(np.ceil(border/2))
cvalue = np.array(color)
if border >= 0:
# get x coordinates for each line(top, bottom) of each side
# if -ve coordinates comes, then make that 0
x11 = np.clip(pt1[0]-b, 0, pt2[0])
x12 = np.clip(pt1[0]+b+1, 0, pt2[0])
x21 = pt2[0]-b
x22 = pt2[0]+b+1
y11 = np.clip(pt1[1]-b, 0, pt2[1])
y12 = np.clip(pt1[1]+b+1, 0, pt2[1])
y21 = pt2[1]-b
y22 = pt2[1]+b+1
# right line
img[x11:x22, y11:y12] = cvalue
#left line
img[x11:x22, y21:y22] = cvalue
# top line
img[x11:x12, y11:y22] = cvalue
# bottom line
img[x21:x22, y11:y22] = cvalue
else:
pt1 = np.clip(pt1, 0, pt2)
img[pt1[0]:pt2[0]+1, pt1[1]:pt2[1]+1] = cvalue
return img
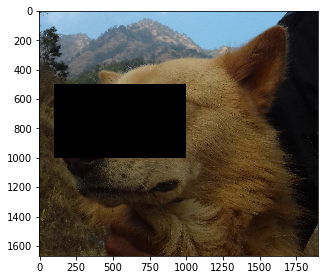
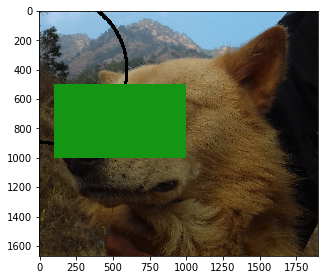
mimg = rectangle(img, (100,500), (1000, 1000), border=-5, color=[20, 150, 20])
ip.show(mimg)

Let’s explain a little bit of the code here:-
- Take an image where we want to draw, take the coordinates of corners, take the border of a rectangle, and take the color of the rectangle.
- Extract the coordinates where we want to draw (if the coordinates are out of the image plane then perform clipping)
- If the border is +ve:
- Change pixels on topmost line(top coordinate along with its some neighbors)
- Change pixels on bottommost line(top coordinate along with its some neighbors)
- Follow the same for other lines.
- Else:
- Fill/Change the color from the top line to the bottom from left to right line.
Compare with OpenCV
Now in this part of drawing simple geometrical shapes on python, we will compare our generated image with OpenCV’s.
# read image
img = ip.read_image("../dog.jpg")
# draw using opencv
print("OpenCV")
cimg = cv2.rectangle(img.copy(), (100, 500), (1000, 1000), [0, 0, 0], -5)
ip.show(cimg)

# draw using our method (swap center)
print("Ours")
mimg = rectangle(img, (100,500), (1000, 1000), border=-5, color=[0, 0, 0])
ip.show(mimg)

# difference
print("Difference")
r = mimg-cimg
r[r!=[0, 0, 0]] = 255
ip.show(r)

# count difference pixels
diff = np.sum(mimg!=cimg)
shape = mimg.shape

# what percentage is different?
diff * 100 / (shape[0] * shape[1])
OpenCV

Ours
Difference
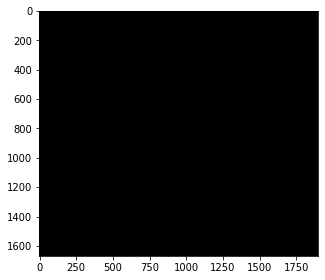
0.0
The comparison with OpenCV seems to be great because we have 0 differences. You can try different sizes of rectangles.
Ellipse
Now on to the 3rd shape of Drawing Simple Geometrical Shapes on Python. Ellipse is a modified version of the circle but it is well described as the portion that lies on a 2d plane when a plane is inclined inside a cone. Please search about this to see the bunch of images. I will again be using the polar form of an ellipse. It is just as simple as the circle except we use an axis instead of a radius.
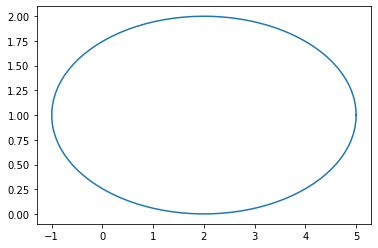
\[x = h + cos(\theta) * a\\ y = k + sin(\theta) * b\]A simple example can be done using Matplotlib’s plot.
h = 2
k = 1
a = 3
b = 1

t = np.linspace(0, 2 * np.pi, 100)
plt.plot(h+a*np.cos(t), k+b*np.sin(t))
plt.plot()
[]
# creating a ellipse
def ellipse(img=None, center=(0, 0), a=3, b=1, border=4, color=[0], smooth=2):
"""
A method to create a ellipse on a give image.
img: Expects numpy ndarray of image.
center: center of a ellipse
a: major axis
b: minor axis
border: border of the ellipse, if -ve, ellipse is filled
color: color for ellipse
smooth: how smooth should our ellipse be?(smooth * 360 angles in 0 to 360)
"""
if type(img) == None:
raise ValueError("Image can not be None. Provide numpy array instead.")
angles = 360
cvalue = np.array(color)
if type(img) != type(None):
shape = img.shape
if len(shape) == 3:
row, col, channels = shape
else:
row, col = shape
channels = 1
angles = np.linspace(0, 360, 360*smooth)
for i in angles:
angle = i*np.pi/180
y = center[1]+b*np.sin(angle)
x = center[0]+a*np.cos(angle)
# since we are wroking on image, coordinate starts from (0, 0) onwards and we have to ignore -ve values
if border >= 0:
r, c = int(x), int(y)
bord = int(np.ceil(border/2))
x1 = np.clip(x-bord, 0, img.shape[0]).astype(np.int32)
y1 = np.clip(y-bord, 0, img.shape[1]).astype(np.int32)
x2 = np.clip(x+bord, 0, img.shape[0]).astype(np.int32)
y2 = np.clip(y+bord, 0, img.shape[1]).astype(np.int32)
img[x1:x2, y1:y2] = cvalue
else:
x = np.clip(x, 0, img.shape[0])
y = np.clip(y, 0, img.shape[1])
r, c = int(x), int(y)
if i > 270:
img[center[0]:r, c:center[1]] = cvalue
elif i > 180:
img[r:center[0], c:center[1]] = cvalue
elif i > 90:
img[r:center[0], center[1]:c] = cvalue
elif i > 0:
img[center[0]:r, center[1]:c] = cvalue
return img
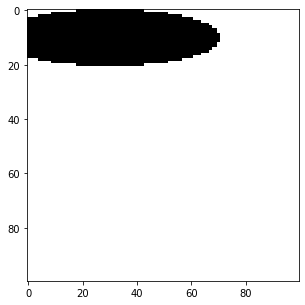
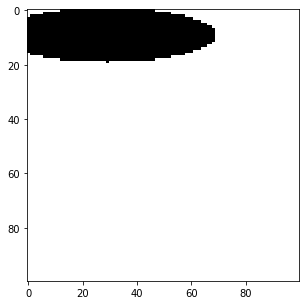
mimg = np.zeros((100, 100, 3), dtype=np.int32) + 255
eimg = ellipse(mimg.copy(), center=(10, 30), a = 10, b = 40, border=-2, color=[0, 0, 0])
ip.show(eimg)

Compare it with OpenCV’s Ellipse
In this part of drawing simple geometrical shapes on python, we are going to compare our generated ellipse with OpenCV’s. The case is just like circles, we have to swap the center and the axes for the ellipse.
cimg = cv2.ellipse(mimg.copy(), (30, 10), (40, 10), 0, 0, 360, [0, 0, 0], -2)
ip.show(cimg)
# difference on fill
diff = np.sum(cimg!=eimg)
shape = cimg.shape

# what percentage is different?
diff * 100 / (shape[0] * shape[1])
4.47
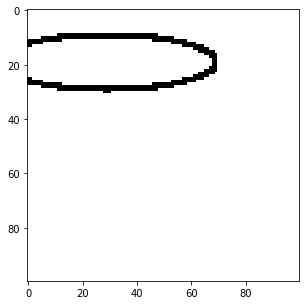
# difference on normal
mimg = np.zeros((100, 100, 3), dtype=np.int32) + 255
eimg = ellipse(mimg.copy(), center=(20, 30), a = 10, b = 40, border=2, color=[0, 0, 0])
print("Ours")
ip.show(eimg)

# opencv's
print("OpenCV's")
cimg = cv2.ellipse(mimg.copy(), (30, 20), (40, 10), 0, 0, 360, [0, 0, 0], 2)
ip.show(cimg)

# difference on fill
diff = np.sum(cimg!=eimg)
shape = cimg.shape

# what percentage is different?
diff * 100 / (shape[0] * shape[1])
Ours
OpenCV's
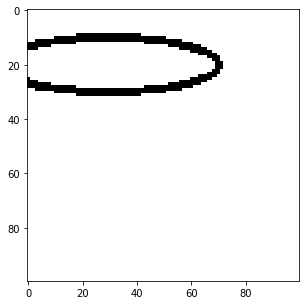
8.55
The difference between OpenCV’s and our method’s output is not that bad. But as always, the difference depends on the size of the shape.
Finally
We have done Drawing Simple Geometrical Shapes on Python. Now on a bonus topic, I will add these methods to our Image Processing class.
Bonus Topic
class ImageProcessing:
    def __init__(self):
        self.readmode = {1 : "RGB", 0 : "Grayscale"}

    def read_image(self, location = "", mode = 1):
        """
            Uses imageio on back.
            * location: Directory of image file.
            * mode: Image readmode{1 : RGB, 0 : Grayscale}.
        """

        img = imageio.imread(location)
        if mode == 1:
            img = img
        elif mode == 0:
            img = self.convert_color(img, 0)
        elif mode == 2:
            pass
        else:
            raise ValueError(f"Readmode not understood. Choose from {self.readmode}.")
        return img

    def show(self, image, figsize=(5, 5)):
        """
            Uses Matplotlib.pyplot.
            * image: A image to be shown.
            * figsize: How big image to show. From plt.figure()

        """
        fig = plt.figure(figsize=figsize)
        im = image
        plt.imshow(im, cmap='gray')
        plt.show()

    def convert_color(self, img, to=0):
        if to==0:
            return  0.21 * img[:,:,0] + 0.72 * img[:,:,1] + 0.07 * img[:,:,2]
        else:
            raise ValueError("Color conversion can not understood.")

    # creating a circle
    def circle(self, img=None, center=(0, 0), rad=10, border=4, color=[1], smooth=2):
        """
            A method to create a circle on a give image.
            img: Expects numpy ndarray of image.
            center: center of a circle
            rad: radius of a circle
            border: border of the circle, if -ve, circle is filled
            color: color for circle
            smooth: how smooth should our circle be?(smooth * 360 angles in 0 to 360)
        """
        if type(img) == None:
            raise ValueError("Image can not be None. Provide numpy array instead.")
        ix = center[0]+rad
        angles = 360
        cvalue = np.array(color)
        if type(img) != type(None):
            shape = img.shape
            if len(shape) == 3:
                row, col, channels = shape
            else:
                row, col = shape
                channels = 1
            angles = np.linspace(0, 360, 360*smooth)
            for i in angles:
                a = i*np.pi/180
                y = center[1]+rad*np.sin(a) # it is p=h*sin(theta)
                x = center[0]+rad*np.cos(a)

                # since we are wroking on image, coordinate starts from (0, 0) onwards and we have to ignore -ve values


                if border >= 0:
                    b = int(np.ceil(border/2))

                    x1 = np.clip(x-b, 0, shape[0]).astype(np.int32)
                    y1 = np.clip(y-b, 0, shape[1]).astype(np.int32)
                    x2 = np.clip(x+b, 0, shape[0]).astype(np.int32)
                    y2 = np.clip(y+b, 0, shape[1]).astype(np.int32)


                    img[x1:x2, y1:y2] = cvalue

                else:
                    x = np.clip(x, 0, shape[0])
                    y = np.clip(y, 0, shape[1])
                    r, c = int(x), int(y)

                    if i > 270:
                        img[center[0]:r, c:center[1]] = cvalue
                    elif i > 180:
                        img[r:center[0], c:center[1]] = cvalue
                    elif i > 90:
                        img[r:center[0], center[1]:c] = cvalue
                    elif i > 0:
                        img[center[0]:r, center[1]:c] = cvalue

            return img

    def rectangle(self, img, pt1, pt2, border=2, color=[0]):
        """
            img: Input image where we want to draw rectangle:
            pt1: top left point (y, x)
            pt2: bottom right point
            border: border of line
            color: color of rectangle line,
            returns new image with rectangle.

        """
        p1 = pt1
        pt1 = (p1[1], p1[0])
        p2 = pt2
        pt2 = (p2[1], p2[0])
        b = int(np.ceil(border/2))
        cvalue = np.array(color)
        if border >= 0:
            # get x coordinates for each line(top, bottom) of each side
            # if -ve coordinates comes, then make that 0
            x11 = np.clip(pt1[0]-b, 0, pt2[0])
            x12 = np.clip(pt1[0]+b+1, 0, pt2[0])
            x21 = pt2[0]-b
            x22 = pt2[0]+b+1

            y11 = np.clip(pt1[1]-b, 0, pt2[1])
            y12 = np.clip(pt1[1]+b+1, 0, pt2[1])
            y21 = pt2[1]-b
            y22 = pt2[1]+b+1
            # right line
            img[x11:x22, y11:y12] = cvalue
            #left line
            img[x11:x22, y21:y22] = cvalue
            # top line
            img[x11:x12, y11:y22] = cvalue
            # bottom line
            img[x21:x22, y11:y22] = cvalue

        else:
            pt1 = np.clip(pt1, 0, pt2)
            img[pt1[0]:pt2[0]+1, pt1[1]:pt2[1]+1] = cvalue

        return img

    # creating a ellipse
    def ellipse(self, img=None, center=(0, 0), a=3, b=1, border=4, color=[0], smooth=2):
        """
            A method to create a ellipse on a give image.
            img: Expects numpy ndarray of image.
            center: center of a ellipse
            a: major axis
            b: minor axis
            border: border of the ellipse, if -ve, ellipse is filled
            color: color for ellipse
            smooth: how smooth should our ellipse be?(smooth * 360 angles in 0 to 360)
        """
        if type(img) == None:
            raise ValueError("Image can not be None. Provide numpy array instead.")
        angles = 360
        cvalue = np.array(color)
        if type(img) != type(None):
            shape = img.shape
            if len(shape) == 3:
                row, col, channels = shape
            else:
                row, col = shape
                channels = 1
            angles = np.linspace(0, 360, 360*smooth)
            for i in angles:
                angle = i*np.pi/180
                y = center[1]+b*np.sin(angle)
                x = center[0]+a*np.cos(angle)


                # since we are wroking on image, coordinate starts from (0, 0) onwards and we have to ignore -ve values
                if border >= 0:
                    r, c = int(x), int(y)
                    bord = int(np.ceil(border/2))
                    x1 = np.clip(x-bord, 0, img.shape[0]).astype(np.int32)
                    y1 = np.clip(y-bord, 0, img.shape[1]).astype(np.int32)
                    x2 = np.clip(x+bord, 0, img.shape[0]).astype(np.int32)
                    y2 = np.clip(y+bord, 0, img.shape[1]).astype(np.int32)

                    img[x1:x2, y1:y2] = cvalue

                else:
                    x = np.clip(x, 0, img.shape[0])
                    y = np.clip(y, 0, img.shape[1])
                    r, c = int(x), int(y)
                    if i > 270:
                        img[center[0]:r, c:center[1]] = cvalue
                    elif i > 180:
                        img[r:center[0], c:center[1]] = cvalue
                    elif i > 90:
                        img[r:center[0], center[1]:c] = cvalue
                    elif i > 0:
                        img[center[0]:r, center[1]:c] = cvalue

            return img


    def convolve(self, image, kernel = None, padding = "zero", stride=(1, 1), show=False, bias = 0):
        """
            * image: A image to be convolved.
            * kernel: A filter/window of odd shape for convolution. Used Sobel(3, 3) default.
            * padding: Border operation. Available from zero, same, none.
            * stride: How frequently do convolution?
        """

        if len(image.shape) > 3:
            raise ValueError("Only 2 and 3 channel image supported.")
        if type(kernel) == type(None):
            warnings.warn("No kernel provided, trying to apply Sobel(3, 3).")
            kernel = np.array([[-1, 0, 1],
                              [-1, 0, 1],
                              [-1, 0, 1]])
            kernel += kernel.T
        kshape = kernel.shape
        if kshape[0] % 2 != 1 or kshape[1] % 2 != 1:
            raise ValueError("Please provide odd length of 2d kernel.")

        if type(stride) == int:
                 stride = (stride, stride)

        shape = image.shape

        if padding == "zero":
            zeros_h = np.zeros(shape[1]).reshape(-1, shape[1])
            zeros_v = np.zeros(shape[0]+2).reshape(shape[0]+2, -1)

            #zero padding
            padded_img = np.vstack((zeros_h, image, zeros_h)) # add rows
            # print(padded_img)
            padded_img = np.hstack((zeros_v, padded_img, zeros_v)) # add cols

            image = padded_img
            shape = image.shape

        elif padding == "same":
            h1 = image[0].reshape(-1, shape[1])
            h2 = image[-1].reshape(-1, shape[1])


            #zero padding
            padded_img = np.vstack((h1, image, h2)) # add rows

            v1 = padded_img[:, 0].reshape(padded_img.shape[0], -1)
            v2 = padded_img[:, -1].reshape(padded_img.shape[0], -1)

            padded_img = np.hstack((v1, padded_img, v2)) # add cols

            image = padded_img
            shape = image.shape
        elif padding == None:
            pass

        rv = 0
        cimg = []
        for r in range(kshape[0], shape[0]+1, stride[0]):
            cv = 0
            for c in range(kshape[1], shape[1]+1, stride[1]):
                chunk = image[rv:r, cv:c]
                soma = (np.multiply(chunk, kernel)+bias).sum()
                try:
                    chunk = int(soma)
                except:
                    chunk = int(0)
                if chunk < 0:
                    chunk = 0
                if chunk > 255:
                    chunk = 255
                cimg.append(chunk)
                cv+=stride[1]
            rv+=stride[0]
        cimg = np.array(cimg, dtype=np.uint8).reshape(int(rv/stride[0]), int(cv/stride[1]))
        if show:
            print(f"Image convolved with \nKernel:{kernel}, \nPadding: {padding}, \nStride: {stride}")
        return cimg
ip = ImageProcessing()
img = ip.read_image("../cb.jpg", mode=0)
cv = ip.convolve(img)
ip.show(cv)

img = ip.read_image("../dog.jpg")
#ip.show(img)
fig = plt.figure(figsize=(5,5))
mimg = ip.circle(img, center=(400, 100), border=20, rad=500)
ip.show(mimg)


mimg = ip.rectangle(img, (100,500), (1000, 1000), border=-5, color=[20, 150, 20])
ip.show(mimg)

mimg = np.zeros((100, 100, 3), dtype=np.int32) + 255
eimg = ip.ellipse(mimg.copy(), center=(10, 30), a = 10, b = 40, border=-2, color=[0, 0, 0])
ip.show(eimg)
C:\ProgramData\Anaconda3\lib\site-packages\ipykernel_launcher.py:211: UserWarning: No kernel provided, trying to apply Sobel(3, 3).
<Figure size 360x360 with 0 Axes>

Thank you so much for reading this drawing simple geometrical shapes on python blog and if you find it interesting why not share it or leave the comments? If you have any queries then you can send me a mail or find me at Twitter as @QuassarianViper.
What next?
- Add functionality to do blurring, noise cancellation, sharpening, etc
- Add functionality to do erosion, dilation, etc operations.
In the meantime how about looking over some of mine works or newsletter?
Why not read more?
- Linear Regression from Scratch
- Writing Popular ML Optimizers from Scratch
- Feed Forward Neural Network from Scratch
- Convolutional Neural Networks from Scratch
- Writing a Simple Image Processing Class from Scratch
- Deploying a RASA Chatbot on Android using Unity3d
- Gesture Based Visually Writing System Using OpenCV and Python
- Naive Bayes for text classifications: Scratch to Framework
- Simple OCR for Devanagari Handwritten Text

Comments