
Getting Started with Apache Superset: Build a COVID-19 Data Dashboard with Docker, WSL, MySQL, and CSV Data
Apache Superset is an open-source data visualization and business intelligence tool. It can be used to create dashboards, explore datasets, build charts, and share data insights with little or no code.
If you are familiar with tools like Tableau, Power BI, or Looker Studio, Superset gives a similar dashboard-building experience, but with an open-source and SQL-friendly workflow.
In this tutorial, we will build a simple COVID-19 dashboard in Apache Superset.
We will cover:
- what Apache Superset is
- installation options
- running Superset with Docker or WSL
- connecting Superset to a database
- uploading CSV data
- creating a time-series chart
- creating a bar chart
- creating a map chart
- creating a dashboard
- common problems and fixes
The original version of this blog used Apache Superset inside WSL because native Windows installation was not smooth. That is still a useful idea, but today the easiest way to try Superset locally is usually through Docker Compose.
What Is Apache Superset?
Apache Superset is a modern data exploration and dashboarding platform.
It can connect to many SQL-speaking databases and lets us create charts without writing a full web application.
With Superset, we can:
- connect to databases
- upload CSV or Excel files
- create datasets
- write SQL queries
- build charts
- create dashboards
- add filters
- export chart data
- share dashboards with users
- manage access and permissions
Superset is especially useful when we want to create internal dashboards quickly.
Why Use Apache Superset?
Apache Superset is useful because:
- it is open source
- it supports many databases
- it has many chart types
- it supports SQL Lab
- it can create dashboards without much code
- it is good for teams that already work with SQL
- it can be self-hosted
It can be a good alternative to commercial BI tools when we want more control over deployment and data access.
Installation Options
There are multiple ways to install Superset.
| Method | Best For |
|---|---|
| Docker Compose | Local testing, learning, development |
| WSL + Docker | Windows users who want a Linux-like environment |
| Native pip install | Advanced users, custom environments |
| Kubernetes | Production deployments |
| Managed Superset/Preset | Teams that do not want to manage infrastructure |
For beginners, Docker Compose is usually the easiest path.
For this blog, I will explain both:
- Recommended modern path: Docker Compose
- Original-style path: WSL/native Python environment
Option 1: Install Superset with Docker Compose
This is the recommended local setup for most beginners.
You need:
- Docker
- Docker Compose
- Git
Clone Superset:
git clone https://github.com/apache/superset.git
cd superset
Start Superset using Docker Compose:
docker compose -f docker-compose-image-tag.yml up
This may take some time because Docker needs to download images and start multiple services.
Once it is ready, open:
http://localhost:8088
Default login in the quickstart environment is usually:
username: admin
password: admin
If the official Superset instructions change, always follow the latest Superset documentation for the exact Docker Compose command.
Option 2: Install Superset in WSL or Linux from Scratch
The original version of this blog used Superset inside WSL because the apache-superset package has operating-system-level dependencies.
If you want to install Superset directly in WSL or Linux, first install system packages.
sudo apt-get update

sudo apt-get install -y \
    build-essential \
    libssl-dev \
    libffi-dev \
    python3-dev \
    python3-pip \
    python3-venv \
    libsasl2-dev \
    libldap2-dev \
    default-libmysqlclient-dev
Create a virtual environment:
python3 -m venv superset_env
source superset_env/bin/activate
Upgrade pip:
pip install --upgrade pip setuptools wheel
Install Superset:
pip install apache-superset
For MySQL support, you may also need:
pip install mysqlclient
or:
pip install pymysql
Native installation can be sensitive to Python versions, package versions, and system dependencies. If it becomes difficult, use Docker Compose instead.
Configure Superset Secret Key
For a real setup, Superset needs a secure secret key.
Create a config file:
mkdir -p ~/.superset
nano ~/.superset/superset_config.py
Add:
SECRET_KEY = "replace-this-with-a-long-random-secret-key"
For a better secret, generate one:
python -c "import secrets; print(secrets.token_urlsafe(42))"
Then make sure Superset can find the config.
export SUPERSET_CONFIG_PATH=~/.superset/superset_config.py
You can add this export line to your shell profile if needed.
Set Up Superset
If you are using the native installation route, initialize Superset.
Create an admin user:
export FLASK_APP=superset
superset fab create-admin
Upgrade the metadata database:
superset db upgrade
Load example data:
superset load_examples
Create default roles and permissions:
superset init
Start Superset:
superset run -p 8088 --with-threads --reload --debugger
Then open:
http://127.0.0.1:8088
In some older tutorials, Superset was opened on port 5000. In newer quickstart examples, 8088 is commonly used.
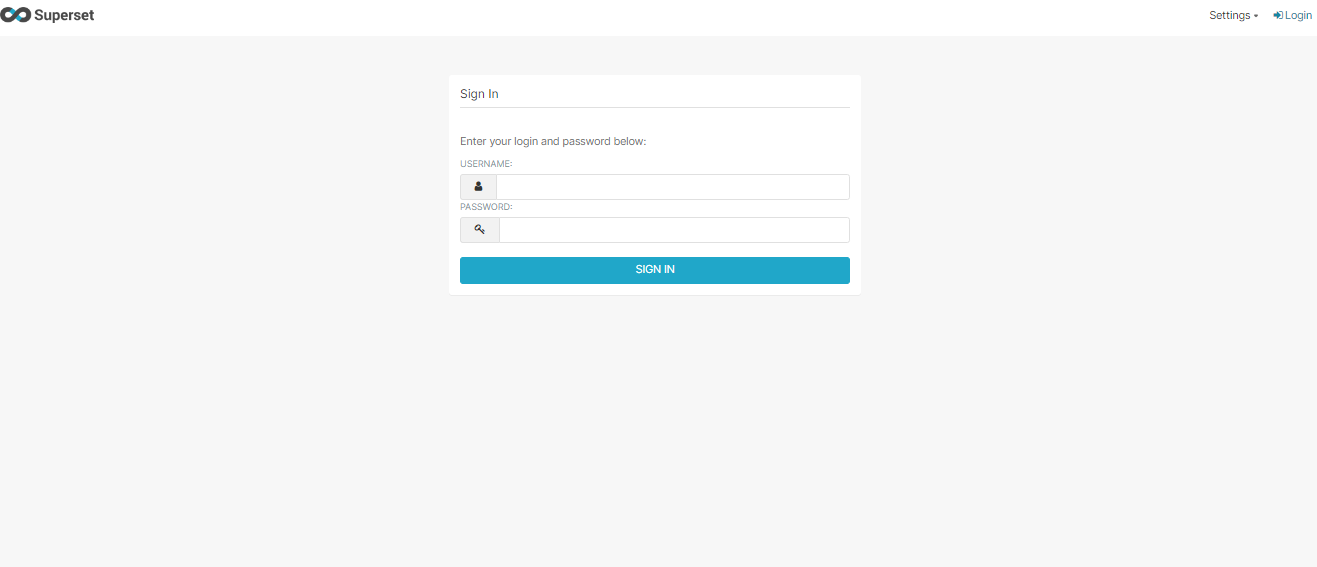
Opening the First Dashboard
If everything works, Apache Superset should be available in the browser.
Login page:
After entering the username and password, the home page may look like this:
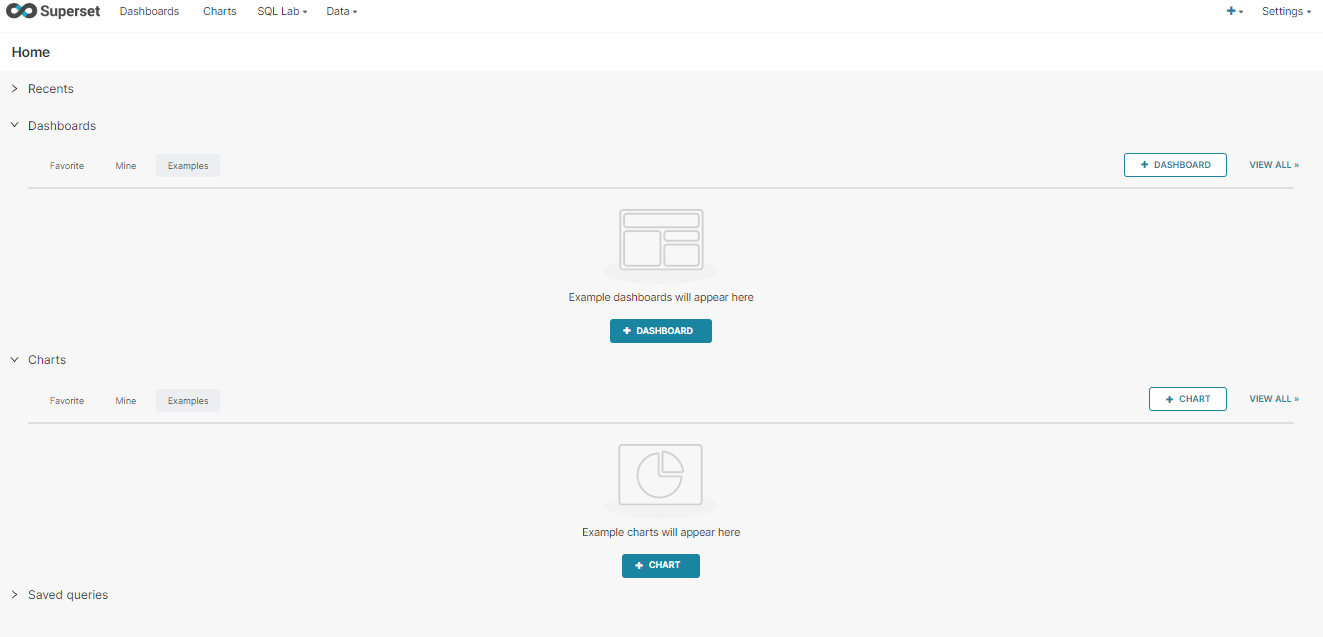
The exact UI may look different depending on the Superset version, but the main ideas are the same.
Preparing Data
To create a useful dashboard, we need data.
For this tutorial, we will use COVID-19 data in CSV format.
The original post used the public COVID-19 data from Our World in Data:
The CSV file contains many columns such as:
- date
- location
- continent
- new cases
- total cases
- new deaths
- total deaths
- population
- vaccination-related columns
- testing-related columns
The dataset is large, so uploads may take some time.
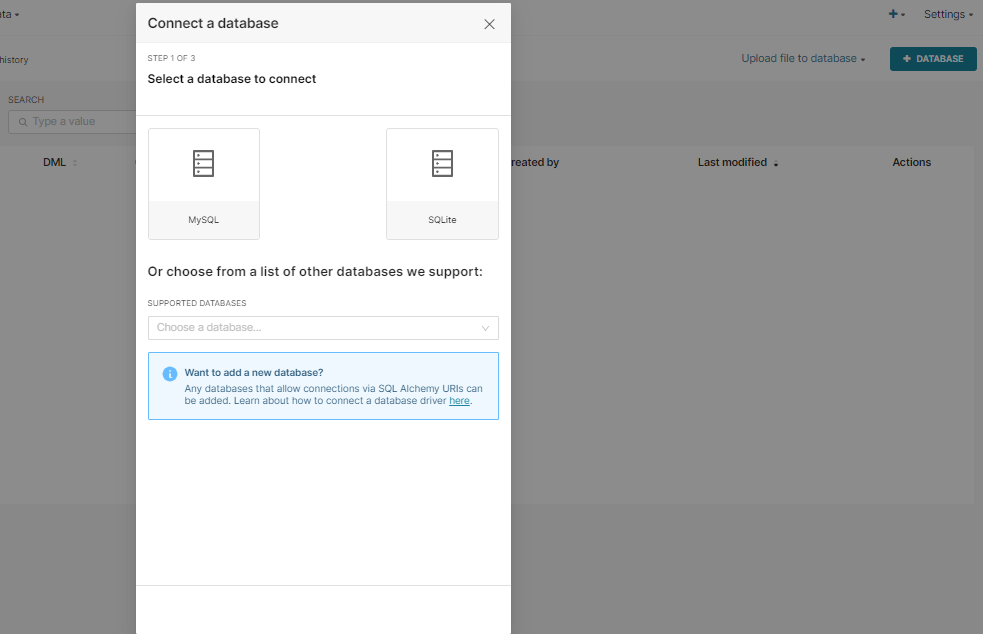
Choosing a Database
In Superset, go to:
Settings → Data → Database Connections
or depending on the version:
Data → Databases
For this project, I used MySQL.
In the original setup:
- Superset was running inside WSL
- MySQL was running on Windows
- so I had to use the Windows network IP from WSL
By default, MySQL runs on port:
3306
If you are using MySQL from WSL, check how WSL can access your Windows host. You can also follow my older post:
Create a MySQL Database
Open MySQL Workbench or MySQL CLI and create a database.
CREATE DATABASE COVID_DASHBOARD;
A typical SQLAlchemy connection URI for MySQL can look like this:
mysql+pymysql://username:password@host:3306/COVID_DASHBOARD
or with mysqlclient:
mysql://username:password@host:3306/COVID_DASHBOARD
Example:
mysql+pymysql://root:password@192.168.1.10:3306/COVID_DASHBOARD
Do not hardcode real passwords in blog posts or public repositories.
Create a connection in Superset:
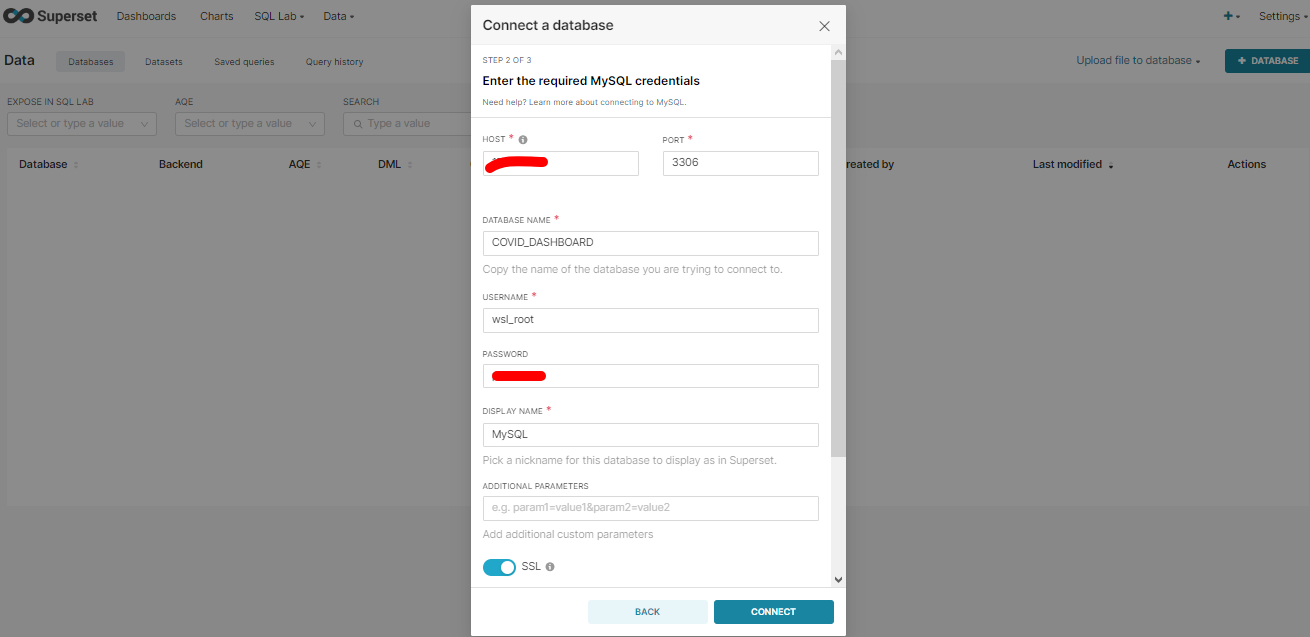
Click Test Connection before saving.
Docker Note for Host Database Connections
If Superset is running inside Docker and your database is running on your host machine, localhost may not work.
In many Docker setups, you can try:
host.docker.internal
For example:
mysql+pymysql://root:password@host.docker.internal:3306/COVID_DASHBOARD
This is often needed because localhost inside a container means the container itself, not your host computer.
Allow CSV Uploads
To upload CSV files into a database through Superset, file upload must be allowed for that database connection.
Open the database settings and go to:
Advanced → Security
Enable:
Allow file uploads to database
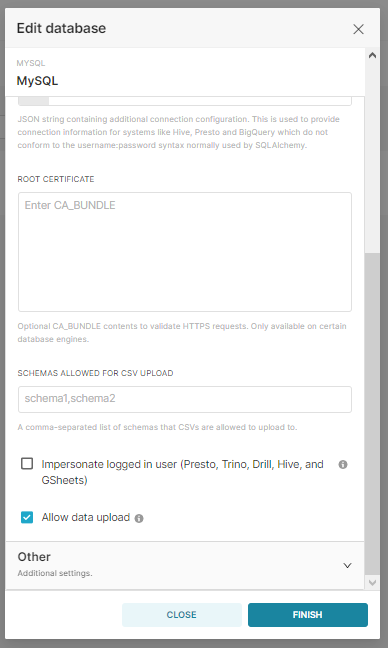
Save the database connection.
Choosing Data
Apache Superset can work with different data sources and formats.
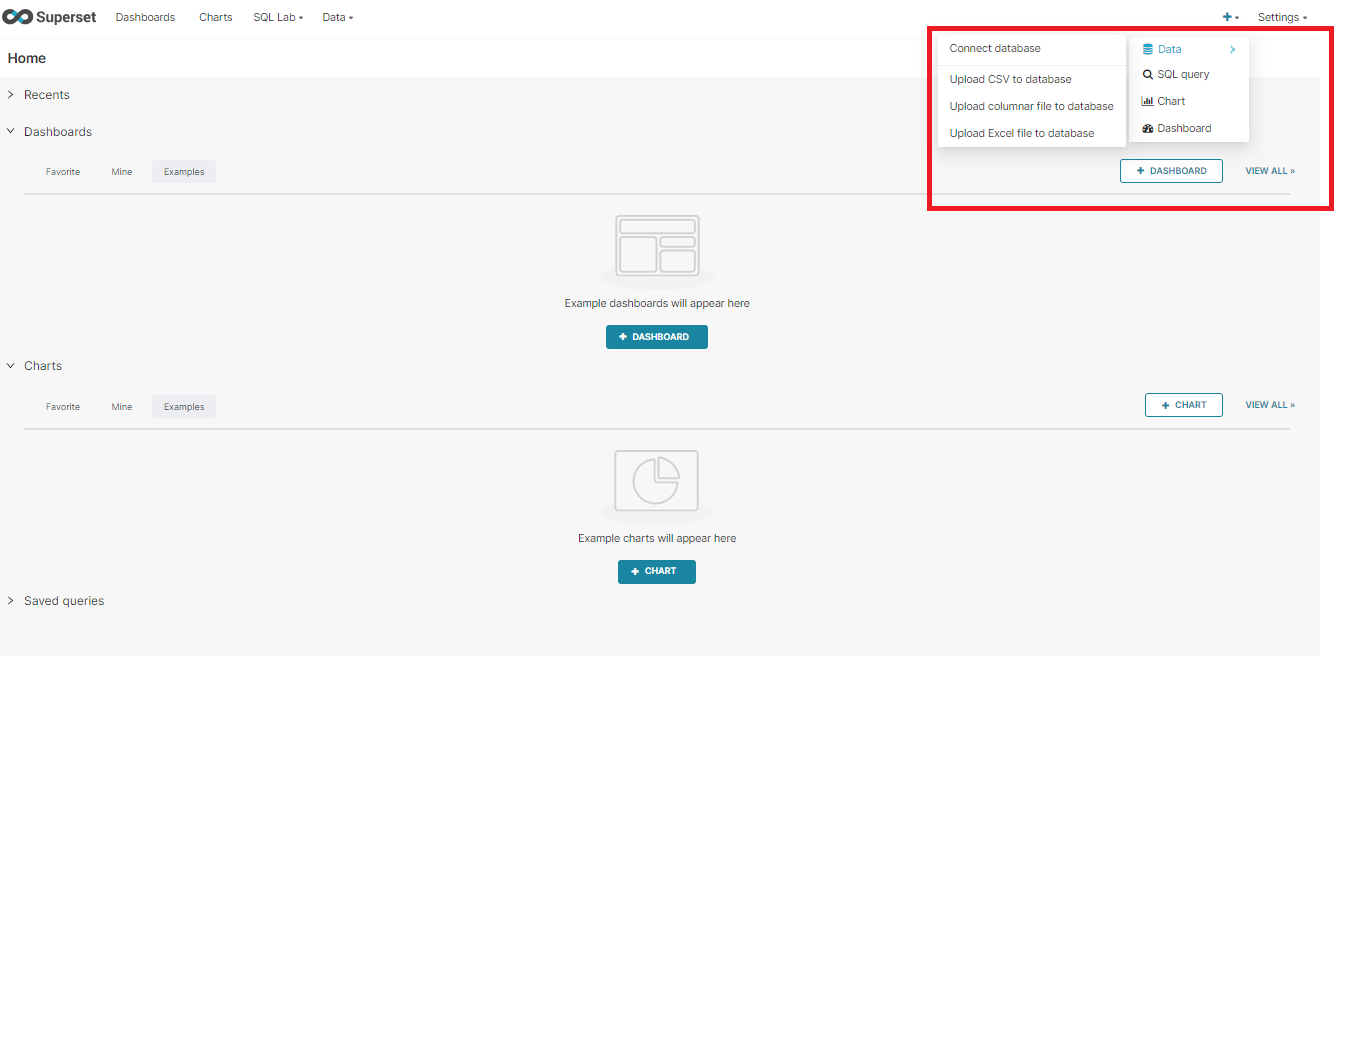
For this project, we will upload a CSV file.
Steps:
- download the COVID-19 CSV file
- go to the upload CSV page
- select the database
- choose table name
- parse date columns
- upload the file
- create a dataset from the uploaded table
Upload page:
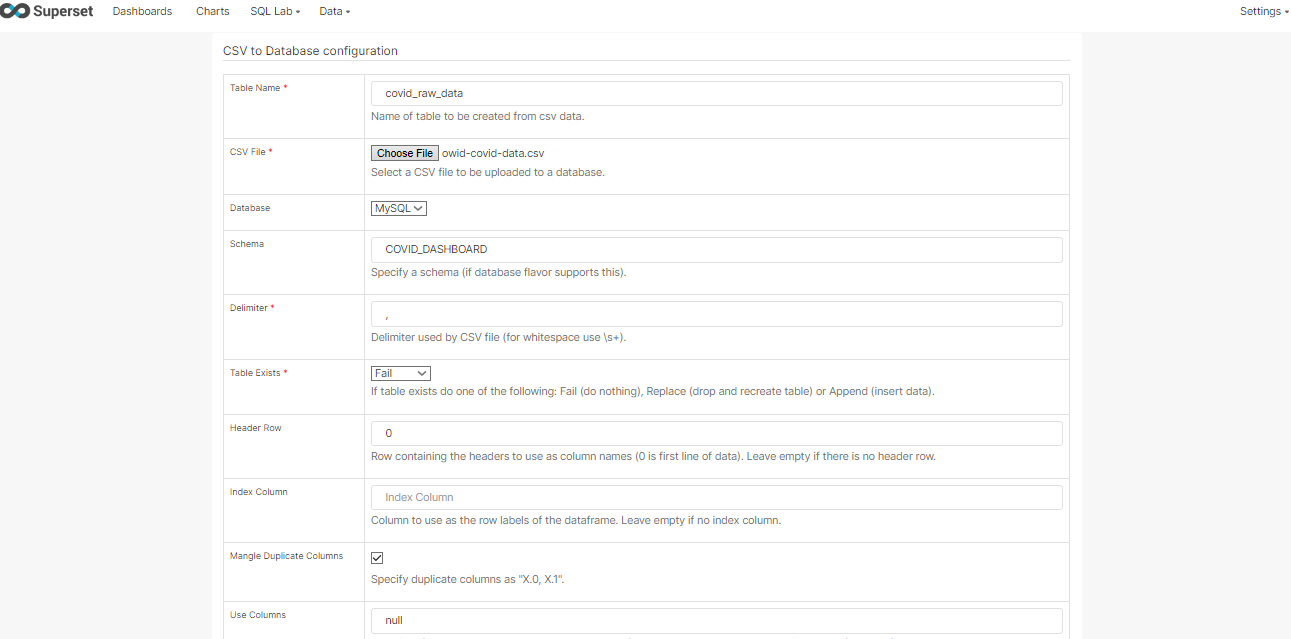
The original dataset had many rows and columns, so upload took some time.
After uploading, check the data in SQL Lab or MySQL.
SELECT *
FROM COVID_DASHBOARD.covid_raw_data
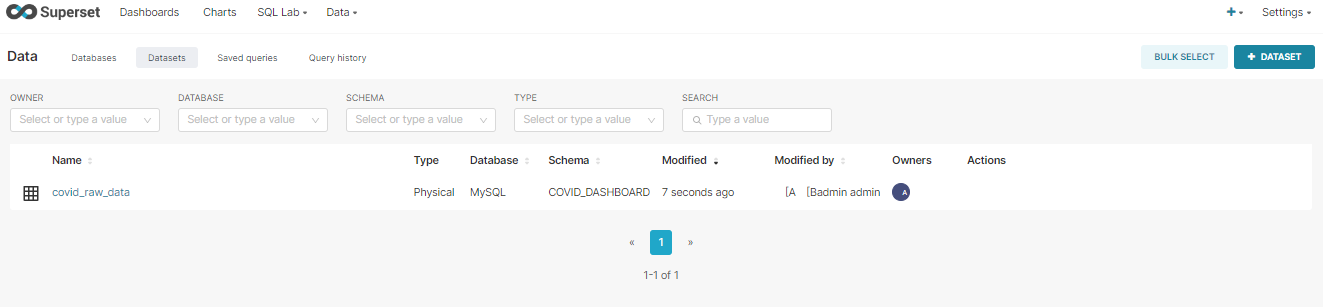
LIMIT 10;
If data is uploaded successfully, Superset should show the dataset.
Clean Important Columns
Before creating charts, make sure important columns have correct data types.
Important columns:
| Column | Recommended Type |
|---|---|
date |
date or datetime |
location |
string |
continent |
string |
new_cases |
numeric |
total_cases |
numeric |
new_deaths |
numeric |
total_deaths |
numeric |
population |
numeric |
If date is treated as text, time-series charts may not work correctly.
You can update the database table type or adjust the dataset column settings in Superset.
Sync Columns from Source
If you changed the table schema in MySQL, sync the dataset in Superset.
Steps:
- open the dataset
- edit dataset
- go to columns
- sync columns from source
- save
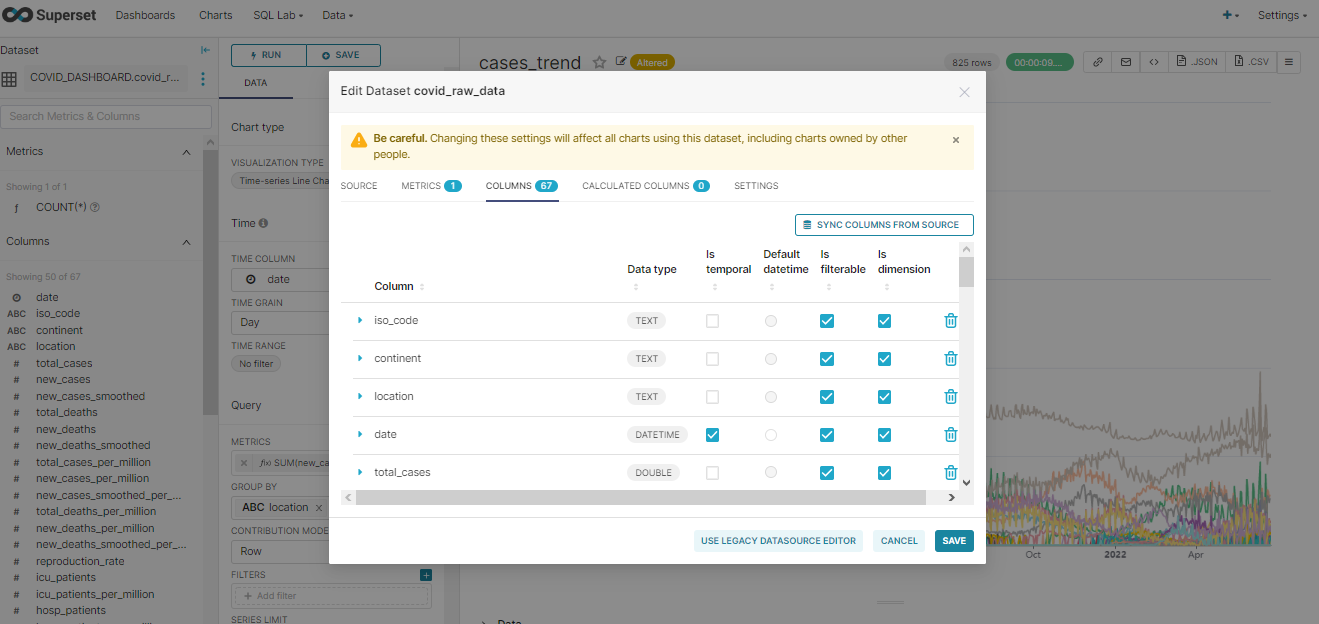
This helps Superset detect updated column types.
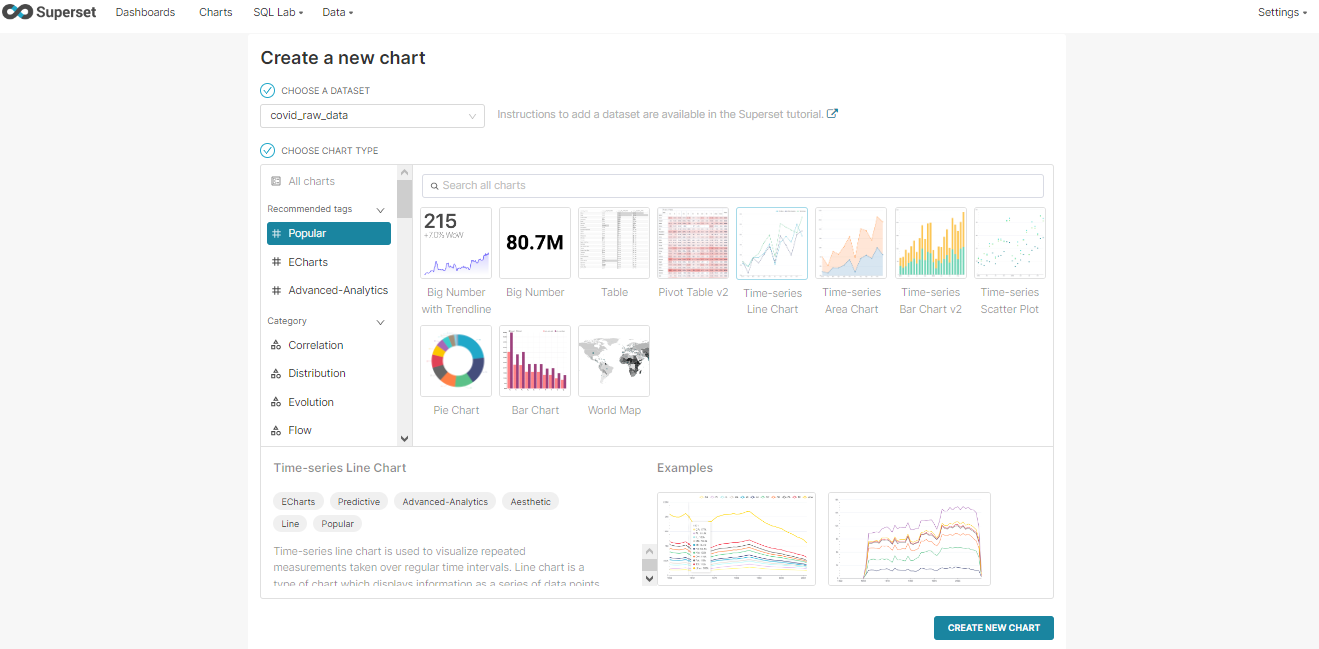
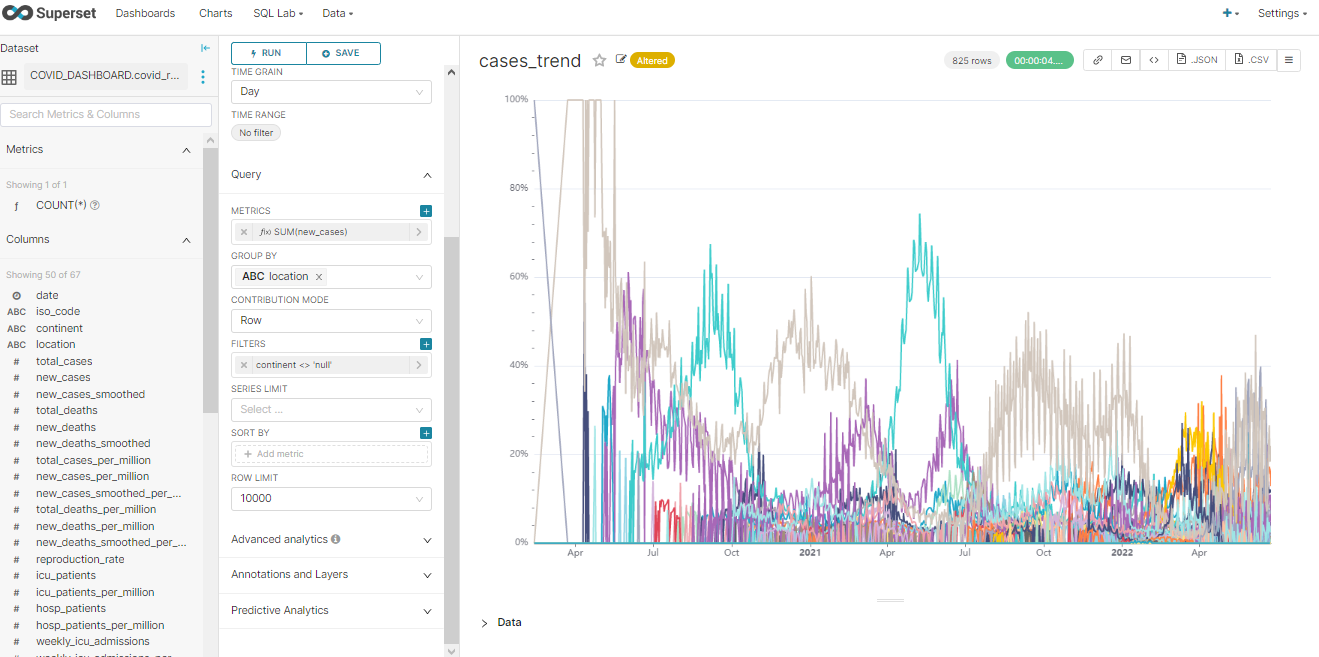
Making a Time-Series Chart
Now we can create the first chart.
Steps:
- go to Charts
- click + Chart
- select the COVID dataset
- choose a time-series chart type
- click Create New Chart
Rename the chart from Untitled to:
Cases Trend
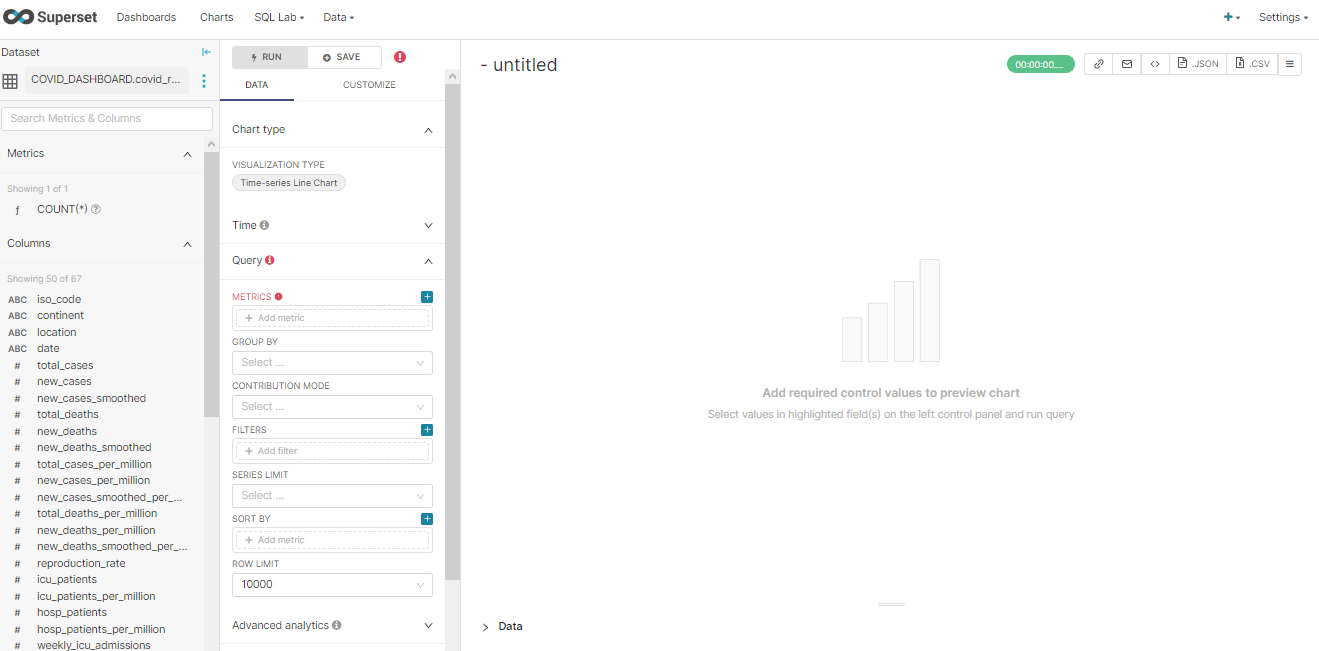
In the chart settings:
- Time column:
date - Time grain: day, week, or month
- Metric:
SUM(new_cases) - Group by:
location - Time range: choose the desired range
Run the query.
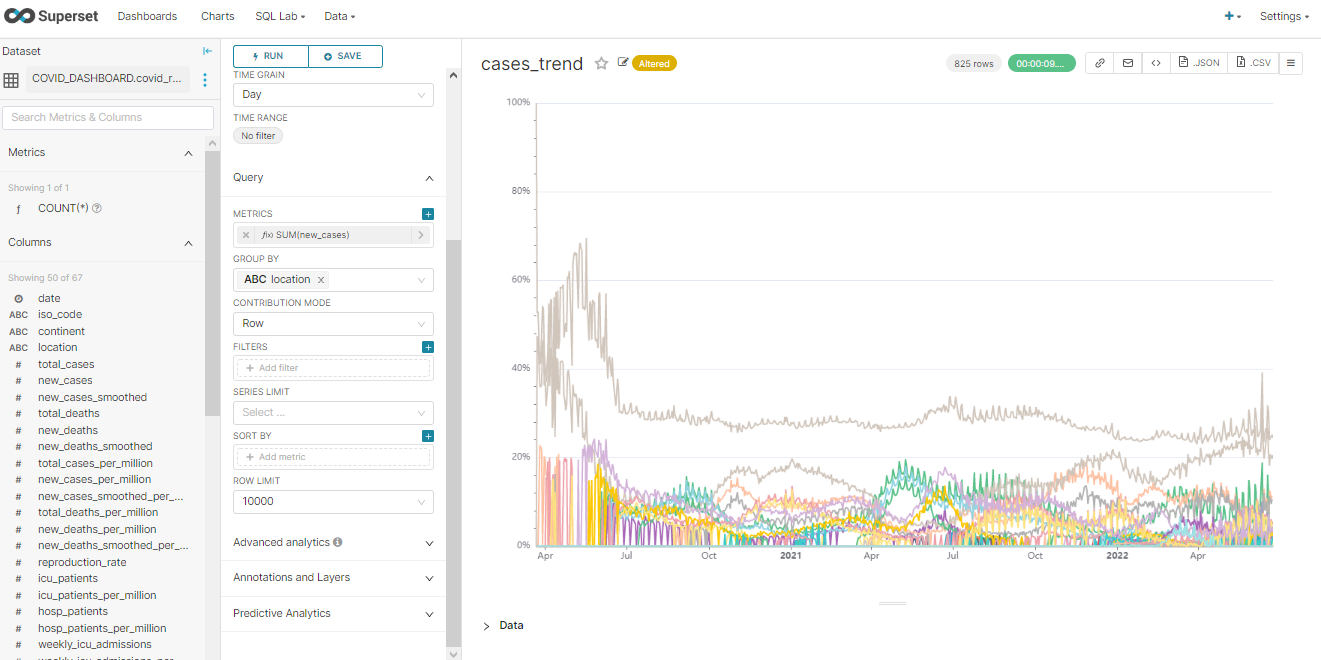
Filter Country-Level Data
The COVID dataset may include rows for continents, income groups, and world-level summaries. If we only want countries, we can filter rows where continent is not null.
Add filter:
continent IS NOT NULL
This removes rows such as:
- World
- Europe
- Asia
- High income
- Low income
Now the chart focuses more on country-level trends.
Add Sorting
For better readability, we can sort by metric value.
For example:
SUM(new_cases) DESC
This helps show the largest values more clearly.
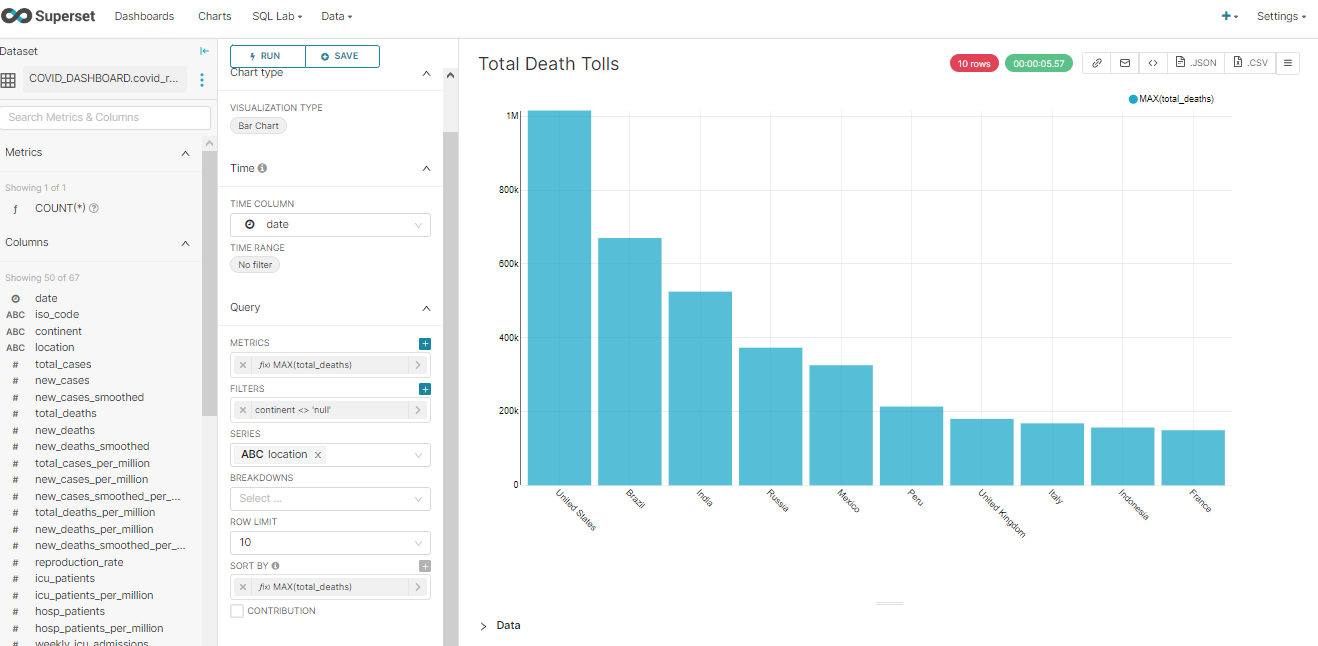
Create a Bar Chart
Next, create a bar chart to show top countries by total deaths.
Chart idea:
Top 10 Countries by Total Deaths
Settings:
- Chart type: Bar Chart
- Dataset: COVID dataset
- Metric:
MAX(total_deaths) - Series or Group By:
location - Filter:
continent IS NOT NULL - Row limit:
10 - Sort by:
MAX(total_deaths)descending
Why MAX(total_deaths)?
Because total_deaths is cumulative. The latest value is usually the maximum value for each country, so MAX(total_deaths) gives the total death count up to the latest available date.
Result:
Create a Map Chart
Next, create a map chart to show total deaths across the world.
Possible settings:
- Chart type: World Map or Country Map
- Country column:
iso_codeor country/location field, depending on the chart type - Metric:
MAX(total_deaths) - Filter:
continent IS NOT NULL
Result:
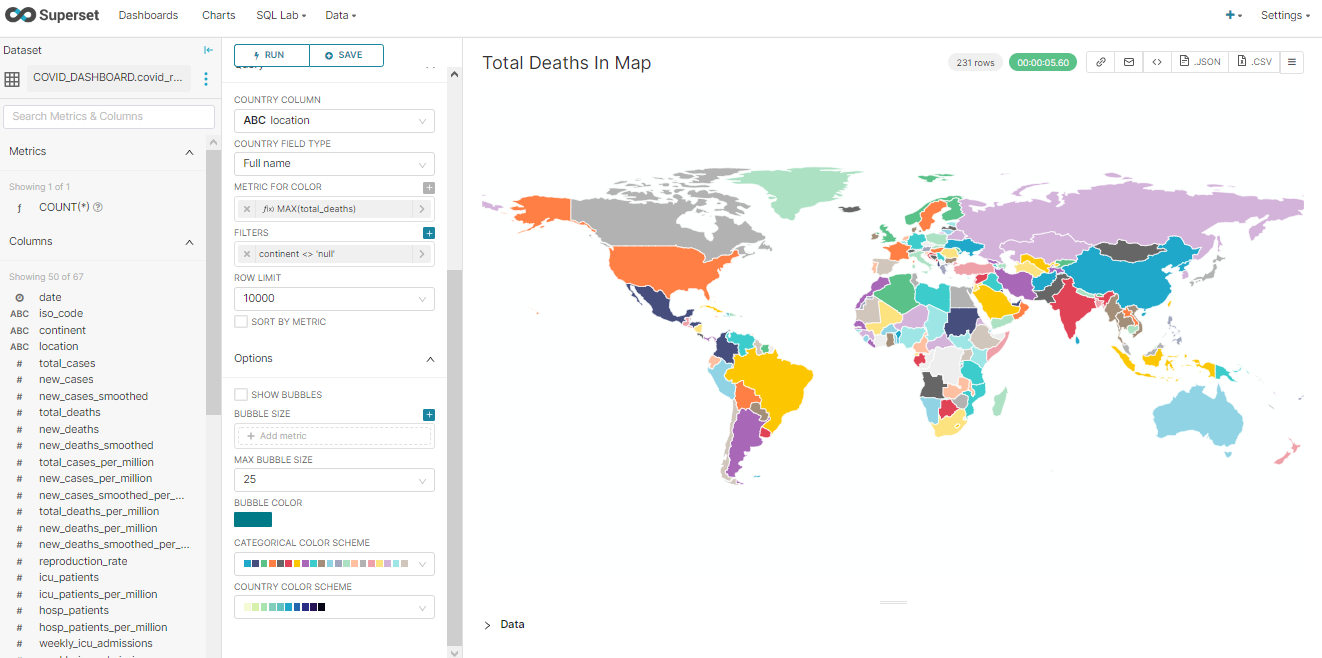
Map charts may require country codes or proper geographic fields depending on the Superset version and chart plugin.
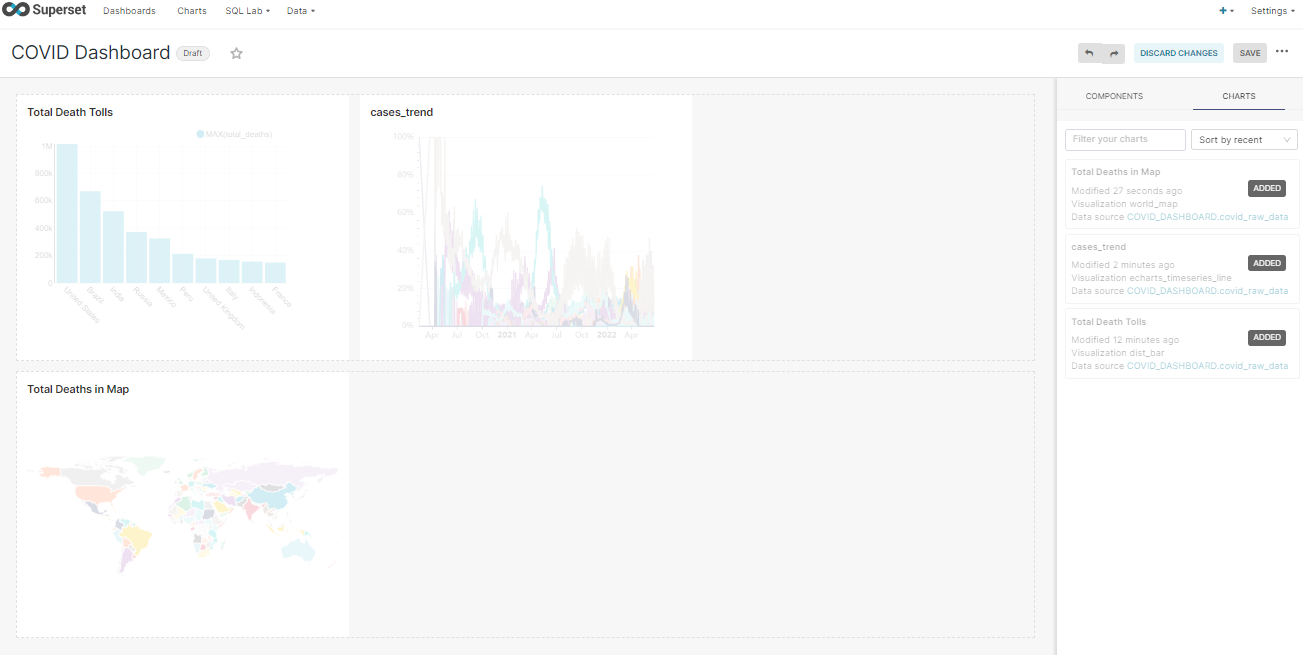
Creating a Dashboard
Now that we have multiple charts, we can create a dashboard.
Go to:
Dashboards → + Dashboard
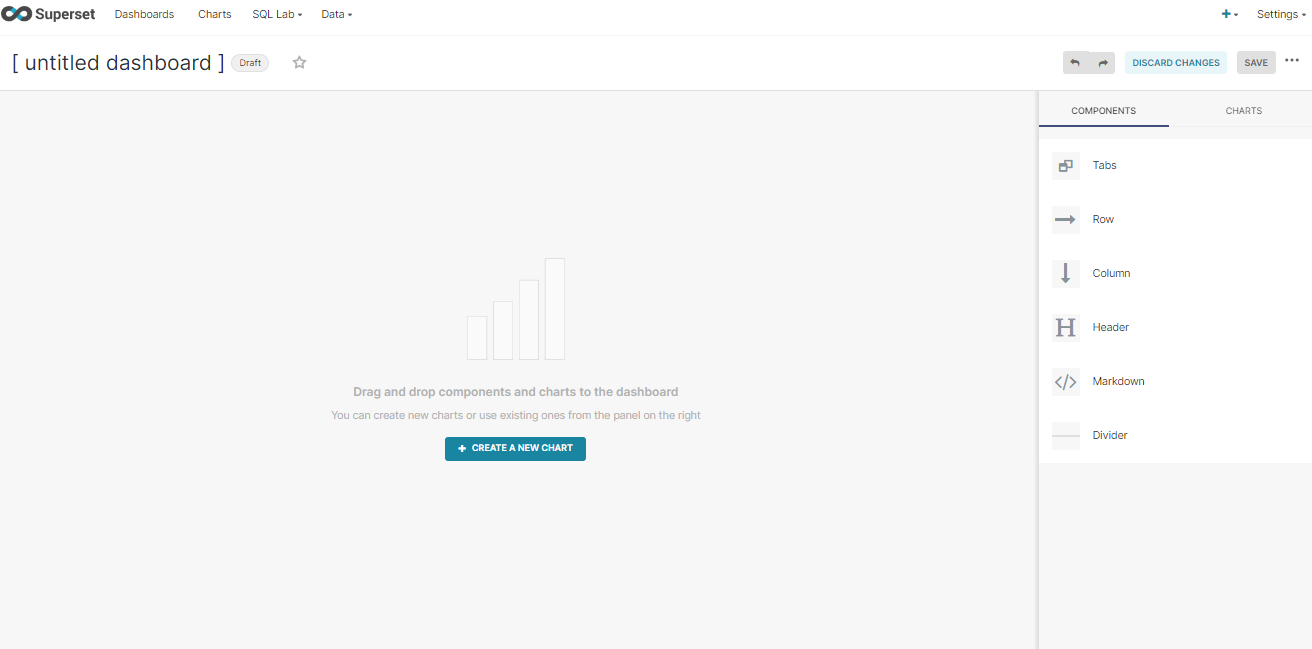
Give the dashboard a name, such as:
COVID-19 Dashboard
Then edit the dashboard and drag charts into the layout.
Arrange the charts as needed.
You can add:
- title
- markdown notes
- filters
- time range filter
- chart rows
- chart tabs
- dashboard description
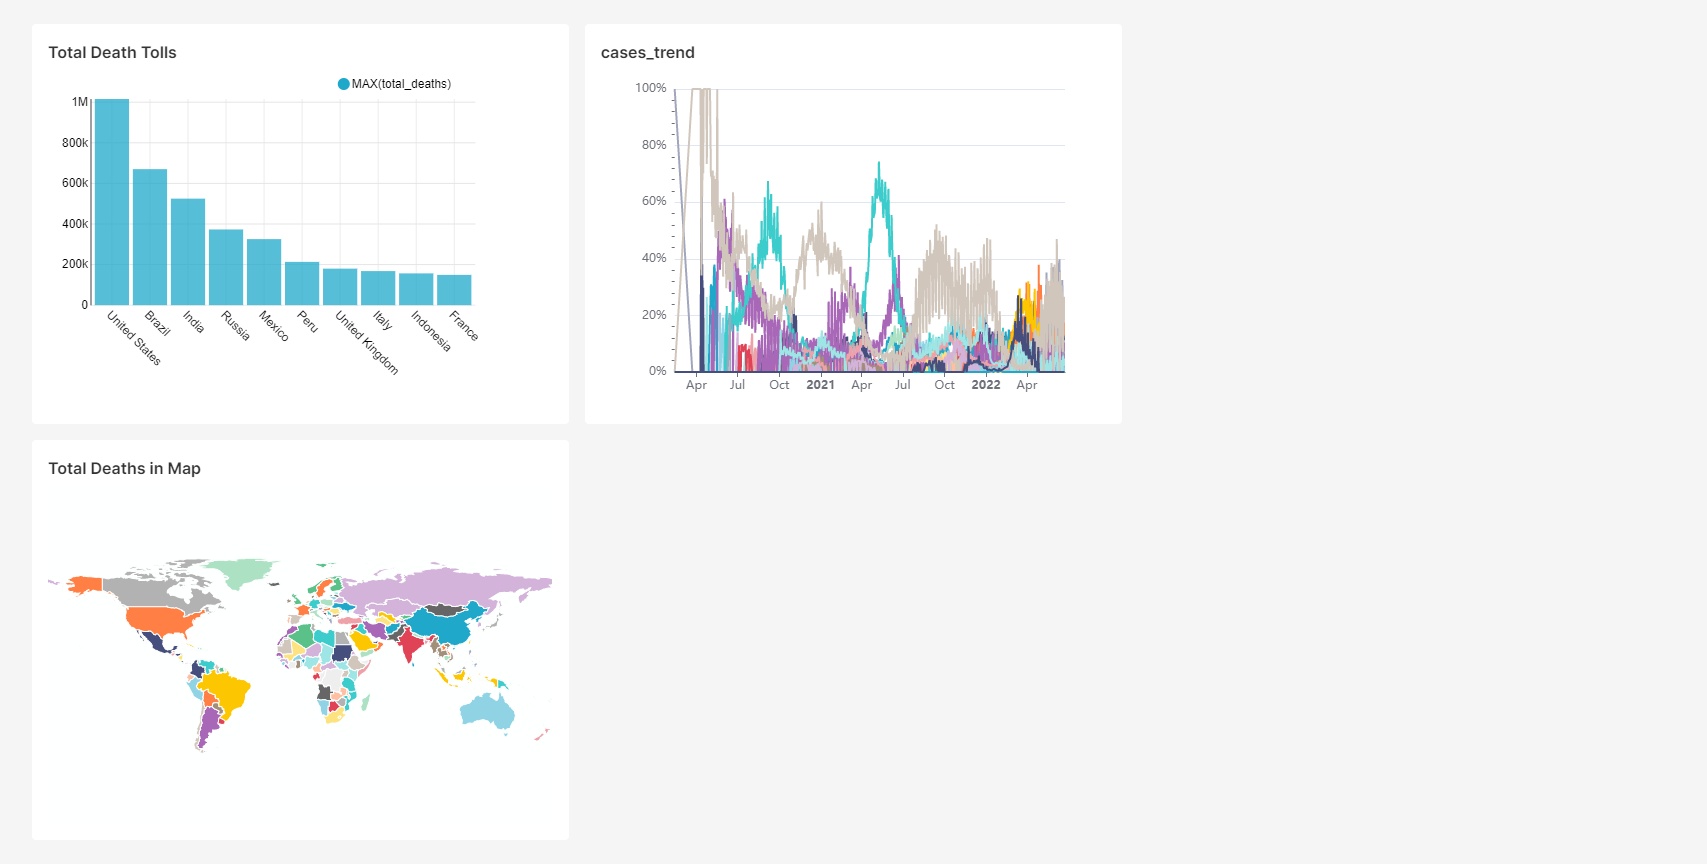
The final dashboard can look like this:
Add Dashboard Filters
Filters make dashboards more useful.
Useful filters for this dashboard:
- location
- continent
- date range
- population range
- metric selector
For example, add a native filter for continent so users can select one continent at a time.
Export Dashboard Image
Superset can export dashboard images depending on the setup and enabled features.
In the original post, I downloaded the dashboard as an image.
For automated screenshots or scheduled reports, Superset may need browser automation dependencies and additional configuration.
Useful SQL Queries
Here are some SQL queries that help inspect the COVID data.
Preview rows:
SELECT *
FROM covid_raw_data
LIMIT 10;
Check row count:
SELECT COUNT(*) AS total_rows
FROM covid_raw_data;
Check countries only:
SELECT DISTINCT location
FROM covid_raw_data
WHERE continent IS NOT NULL
ORDER BY location;
Top countries by total deaths:
SELECT
    location,
    MAX(total_deaths) AS total_deaths
FROM covid_raw_data
WHERE continent IS NOT NULL
GROUP BY location
ORDER BY total_deaths DESC
LIMIT 10;
Daily cases trend:
SELECT
    date,
    location,
    SUM(new_cases) AS new_cases
FROM covid_raw_data
WHERE continent IS NOT NULL
GROUP BY date, location
ORDER BY date;
These queries can help you understand the data before building charts.
Common Problems and Fixes
Problem 1: Superset Does Not Start
Check logs.
For Docker:
docker compose logs -f
For native install:
superset run -p 8088 --debugger --reload
Possible causes:
- wrong Python version
- missing system dependencies
- missing secret key
- database migration not run
- package conflict
Problem 2: Cannot Connect to MySQL
Check:
- MySQL server is running
- host is correct
- port is
3306 - username and password are correct
- MySQL allows remote connections
- firewall allows connection
- correct Python database driver is installed
For Docker, try:
host.docker.internal
instead of:
localhost
Problem 3: CSV Upload Option Is Missing
Enable file upload in database settings:
Advanced → Security → Allow file uploads to database
Then save and refresh.
Problem 4: Date Column Is Not Recognized
Make sure the date column is parsed as a date during upload.
If already uploaded, change the column type in the database or dataset settings, then sync columns from source.
Problem 5: Chart Shows Continent Names as Countries
Filter out rows where continent is null.
continent IS NOT NULL
Problem 6: Dashboard Is Slow
Possible fixes:
- reduce dataset size
- add database indexes
- use aggregated tables
- limit chart row counts
- cache expensive queries
- avoid too many high-cardinality groupings
- precompute summary tables
Best Practices
For better Superset dashboards:
- clean data before uploading
- use meaningful chart names
- use consistent colors
- avoid too many charts in one dashboard
- add filters for interactivity
- use clear metrics
- document assumptions in markdown boxes
- avoid raw columns when metrics are better
- use SQL Lab to test queries first
- use database indexes for large data
Production Notes
The setup in this tutorial is good for learning and local dashboards.
For production, think about:
- proper metadata database such as PostgreSQL
- Redis or another cache backend
- HTTPS
- user authentication
- backups
- role-based access control
- secure database credentials
- scaling workers
- monitoring logs
- deployment through Docker, Kubernetes, or managed services
Docker Compose is convenient for local testing, but production needs more careful planning.
Final Thoughts
In this blog, we explored Apache Superset by creating a COVID-19 data dashboard. We installed Superset, connected a database, uploaded CSV data, created charts, filtered country-level data, and built a dashboard.
Superset is powerful because it lets us build useful dashboards with little code. If you are comfortable with SQL, you can customize charts and datasets even more.
There are many more features to explore, such as SQL Lab, dashboard filters, alerts, reports, access control, custom metrics, and advanced chart types. This tutorial is only the starting point.


Comments