Creating Awesome Data Dashboard with Plotly in Streamlit: Clustering
This is a continuation of our previous blog entitled as Creating Data Dashboards With Streamlit and Python.
Adding A Clustering Functionality
Before diving into the clustering functionality in our existing app, please make sure you are following previous part. Or you can grab all the codes from below:
import streamlit as st
import numpy as np
import pandas as pd
import cufflinks

@st.cache
def get_data(url):
    df = pd.read_csv(url)
    df["date"] = pd.to_datetime(df.date).dt.date
    df['date'] = pd.DatetimeIndex(df.date)

    return df

url = "https://covid.ourworldindata.org/data/owid-covid-data.csv"
data = get_data(url)

locations = data.location.unique().tolist()

sidebar = st.sidebar

analysis_type = sidebar.radio("Analysis Type", ["Single", "Multiple"])
st.markdown(f"Analysis Mode: {analysis_type}")

if analysis_type=="Single":
    location_selector = sidebar.selectbox(
        "Select a Location",
        locations
    )
    st.markdown(f"# Currently Selected {location_selector}")
    trend_level = sidebar.selectbox("Trend Level", ["Daily", "Weekly", "Monthly", "Quarterly", "Yearly"])
    st.markdown(f"### Currently Selected {trend_level}")

    show_data = sidebar.checkbox("Show Data")

    trend_kwds = {"Daily": "1D", "Weekly": "1W", "Monthly": "1M", "Quarterly": "1Q", "Yearly": "1Y"}
    trend_data = data.query(f"location=='{location_selector}'").\
        groupby(pd.Grouper(key="date",
        freq=trend_kwds[trend_level])).aggregate(new_cases=("new_cases", "sum"),
        new_deaths = ("new_deaths", "sum"),
        new_vaccinations = ("new_vaccinations", "sum"),
        new_tests = ("new_tests", "sum")).reset_index()

    trend_data["date"] = trend_data.date.dt.date

    new_cases = sidebar.checkbox("New Cases")
    new_deaths = sidebar.checkbox("New Deaths")
    new_vaccinations = sidebar.checkbox("New Vaccinations")
    new_tests = sidebar.checkbox("New Tests")

    lines = [new_cases, new_deaths, new_vaccinations, new_tests]
    line_cols = ["new_cases", "new_deaths", "new_vaccinations", "new_tests"]
    trends = [c[1] for c in zip(lines,line_cols) if c[0]==True]


    if show_data:
        tcols = ["date"] + trends
        st.dataframe(trend_data[tcols])

    subplots=sidebar.checkbox("Show Subplots", True)
    if len(trends)>0:
        fig=trend_data.iplot(kind="line", asFigure=True, xTitle="Date", yTitle="Values",
                            x="date", y=trends, title=f"{trend_level} Trend of {', '.join(trends)}.", subplots=subplots)
        st.plotly_chart(fig, use_container_width=False)

if analysis_type=="Multiple":
    selected = sidebar.multiselect("Select Locations ", locations)
    st.markdown(f"## Selected Locations: {', '.join(selected)}")
    show_data = sidebar.checkbox("Show Data")
    trend_level = sidebar.selectbox("Trend Level", ["Daily", "Weekly", "Monthly", "Quarterly", "Yearly"])
    st.markdown(f"### Currently Selected {trend_level}")

    trend_kwds = {"Daily": "1D", "Weekly": "1W", "Monthly": "1M", "Quarterly": "1Q", "Yearly": "1Y"}

    trend_data = data.query(f"location in {selected}").\
        groupby(["location", pd.Grouper(key="date",
        freq=trend_kwds[trend_level])]).aggregate(new_cases=("new_cases", "sum"),
        new_deaths = ("new_deaths", "sum"),
        new_vaccinations = ("new_vaccinations", "sum"),
        new_tests = ("new_tests", "sum")).reset_index()

    trend_data["date"] = trend_data.date.dt.date

    new_cases = sidebar.checkbox("New Cases")
    new_deaths = sidebar.checkbox("New Deaths")
    new_vaccinations = sidebar.checkbox("New Vaccinations")
    new_tests = sidebar.checkbox("New Tests")

    lines = [new_cases, new_deaths, new_vaccinations, new_tests]
    line_cols = ["new_cases", "new_deaths", "new_vaccinations", "new_tests"]
    trends = [c[1] for c in zip(lines,line_cols) if c[0]==True]

    ndf = pd.DataFrame(data=trend_data.date.unique(),columns=["date"])

    for s in selected:
        new_cols = ["date"]+[f"{s}_{c}" for c in line_cols]
        tdf = trend_data.query(f"location=='{s}'")
        tdf.drop("location", axis=1, inplace=True)
        tdf.columns=new_cols
        ndf=ndf.merge(tdf,on="date",how="inner")

    if show_data:
        if len(ndf)>0:
            st.dataframe(ndf)
        else:
            st.markdown("Empty Dataframe")

    new_trends = []
    for c in trends:
        new_trends.extend([f"{s}_{c}" for s in selected])

    subplots=sidebar.checkbox("Show Subplots", True)
    if len(trends)>0:
        st.markdown("### Trend of Selected Locations")

        fig=ndf.iplot(kind="line", asFigure=True, xTitle="Date", yTitle="Values",
                            x="date", y=new_trends, title=f"{trend_level} Trend of {', '.join(trends)}.", subplots=subplots)
        st.plotly_chart(fig, use_container_width=False)
K Means Clustering
We have created an awesome blog about K Means clustering from the scratch if you would like to implement it. But now we are going to use it from SKlearn.
Algorithm
Let \(P = {p_1,p_2,p_3,...,p_n}\) be the set of data points and \(C = {c_1,c_2,c_3,...,c_n}\) be the set of centers.
- Step 1: Initially randomly select appropriate numbers of “c” cluster center.
- Step 2: Calculate distance between each data point \(P = {p_1,p_2,p_3,...,p_n}\) and cluster center ‘c’.
- Step 3: Keep data points to the cluster center whose distance from the cluster center is minimum of all the cluster centers. Here we calculate the distance using euclidean distance. Mathematically, \(= \sum_{i=1}^n (x_i^2-y_i^2)\)
- Step 4: Now, recalculate the new cluster center using \(\frac{1}{c}\sum_{i=1}^c x_i\) where \(c_i\) represent the number of data point in \(i^th\) clusters.
- Step 5: Again calculate the distance between new cluster centers and each data points.
- Step 6: If number of data points in a cluster are updated then repeat step 3 otherwise terminate.
For our experiment, lets try to make cluster of countries based on total deaths.
Lets import sklearn’s KMeans class along with Plotly’s functions to plot and also import cufflinks and configure it. We wont be using this in our Strealit app though.
import cufflinks
import numpy as np
import pandas as pd
from sklearn.cluster import KMeans
import plotly.express as px
import plotly.io as pio
import plotly.graph_objects as go
import warnings
warnings.filterwarnings("ignore")
cufflinks.go_offline()
cufflinks.set_config_file(world_readable=True, theme='pearl')
pio.renderers.default = "notebook" # should change by looking into pio.renderers
data = pd.read_csv("owid-covid-data.csv")
First lets clean our data and take only those rows for which date is latest and only valid country names. That means, we will exclude those locations which are not country.
df = data[~data.location.isin(["Lower middle income", "North America", "World", "Asia", "Europe",
                           "European Union", "Upper middle income",
                           "High income", "South America"])]

tdf = df.sort_values("date").drop_duplicates(subset=["location"],keep="last")
Lets select some of useful columns in our data because there are lots of them.
columns=['total_cases', 'new_cases',
       'new_cases_smoothed', 'total_deaths', 'new_deaths',
       'new_deaths_smoothed', 'total_cases_per_million',
       'new_cases_per_million', 'new_cases_smoothed_per_million',
       'total_deaths_per_million', 'new_deaths_per_million',
       'new_deaths_smoothed_per_million', 'new_tests', 'total_tests',
       'total_tests_per_thousand', 'new_tests_per_thousand',
       'new_tests_smoothed', 'new_tests_smoothed_per_thousand',
       'tests_per_case', 'positive_rate', 'stringency_index',
       'population', 'population_density', 'median_age', 'aged_65_older',
       'aged_70_older', 'gdp_per_capita', 'extreme_poverty',
       'cardiovasc_death_rate', 'diabetes_prevalence', 'female_smokers',
       'male_smokers', 'handwashing_facilities', 'hospital_beds_per_thousand',
       'life_expectancy', 'human_development_index']
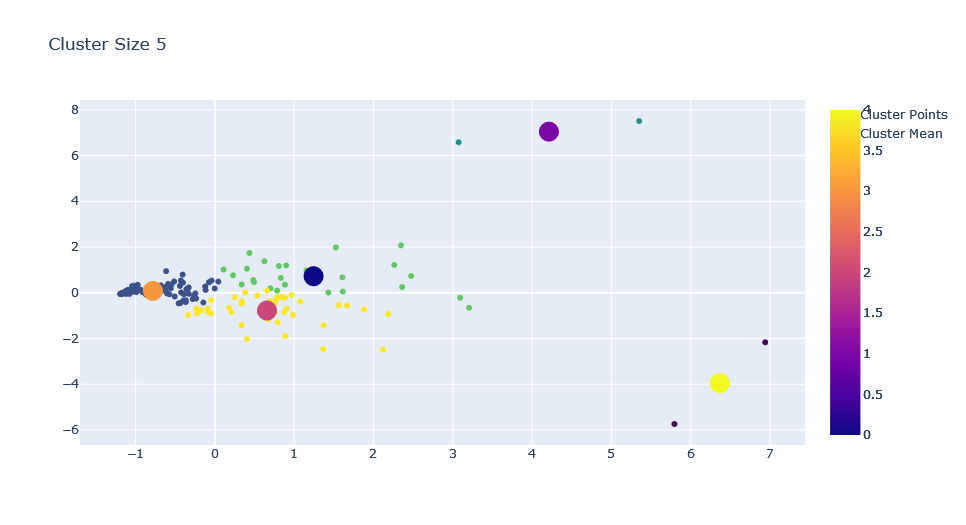
Lets train KMeans and find the optimal number of K for our case. We will only run a simple step here just because our goal is to implement it in the Streamlit app but not here.
from sklearn.cluster import KMeans

k=5


cols=["gdp_per_capita","new_cases_per_million", "new_deaths_per_million", "population_density","total_deaths"]


vdf = tdf.dropna(subset=cols)
X = vdf[cols]

inertias = []

# loop through range of Ks to find optimal value of k
for c in range(2, k):
    # initialize model with number of clusters
    model = KMeans(n_clusters=c)

    # fit a model
    model.fit(X)

    # predict a model
    y_kmeans = model.predict(X)

    # insert the prediction
    vdf["cluster"]=y_kmeans

    # append the intertia so that we could visualize it later on
    inertias.append((c, model.inertia_))

    # plot a scatterplot using plotly's go, select x as cols[0] and y as cols[1]
    # show location name while hovering point,
    # make size of marker variable of total deaths
    # make color variable of cluster value
    # also plot cluster center
    fig=go.Figure(data=[go.Scatter(x=vdf[cols[0]],y=vdf[cols[1]],mode="markers",
                                   name="Countries",
                                   text=vdf["location"],
                                      marker = dict(
                                    size = vdf["total_deaths"]%20,
                                    opacity = 0.9,
                                    reversescale = True,
                                    symbol = 'pentagon',
                                    color=vdf["cluster"]

                                    ),
                                  ),
                        go.Scatter(x=model.cluster_centers_[:,0], y=model.cluster_centers_[:,1],
                                   mode="markers", name="Cluster Center",
                                   text=("Cluster " + vdf.cluster.astype(str)).unique(),
                                   marker = dict(
                                    size = 20,
                                    opacity = 0.8,
                                    reversescale = True,
                                    autocolorscale = False,
                                    symbol = 'circle',
                                    color=vdf.cluster.unique(),
                                    line = dict(
                                        width=1,
                                        color='rgba(102, 102, 102)'
                                    ))),
                       ])
    fig.show()

# plot a intertia to find optimal value of k in KMeans
inertias=np.array(inertias).reshape(-1,2)
performance = go.Scatter(x=inertias[:,0], y=inertias[:,1])
layout = go.Layout(
    title="Cluster Number vs Inertia",
    xaxis=dict(
        title="Ks"
    ),
    yaxis=dict(
        title="Inertia"
    ) )
fig=go.Figure(data=go.Data([performance]))
fig.update_layout(layout)
fig.show()
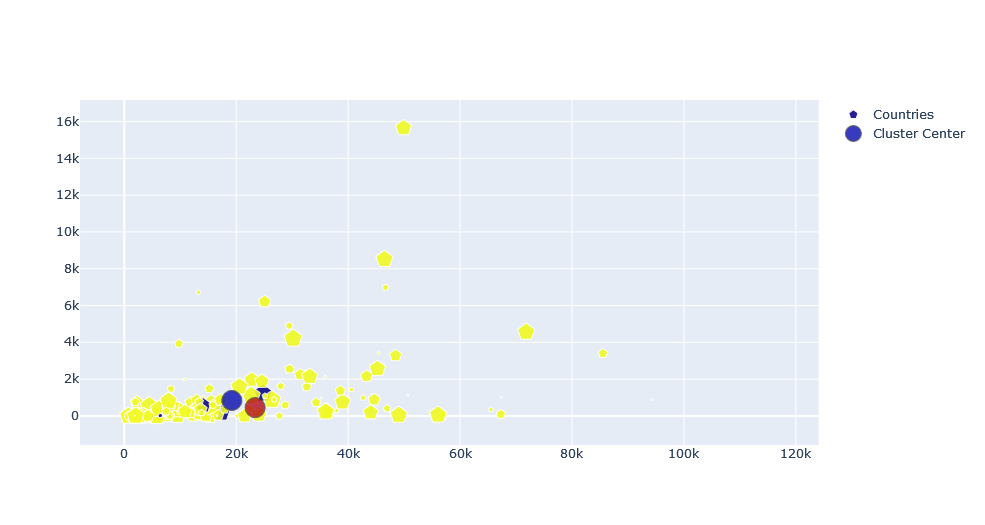
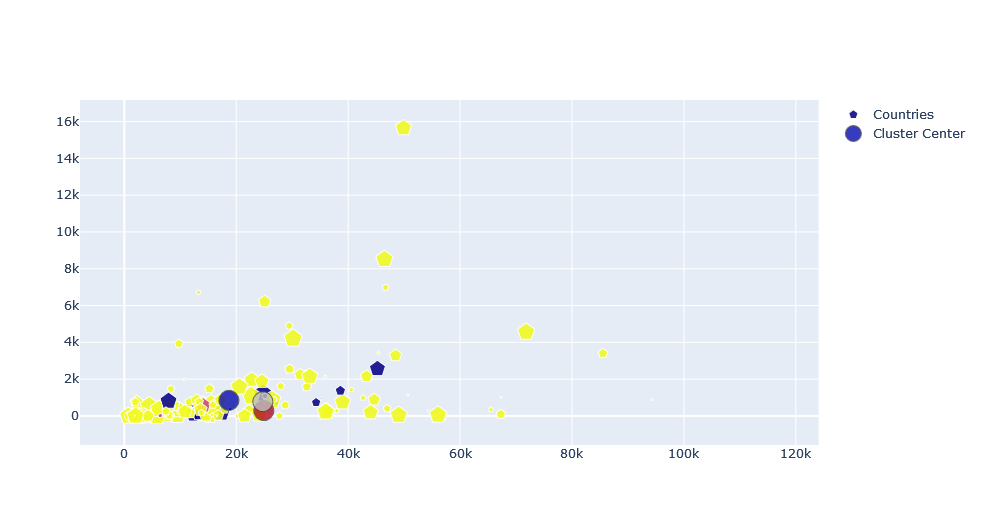
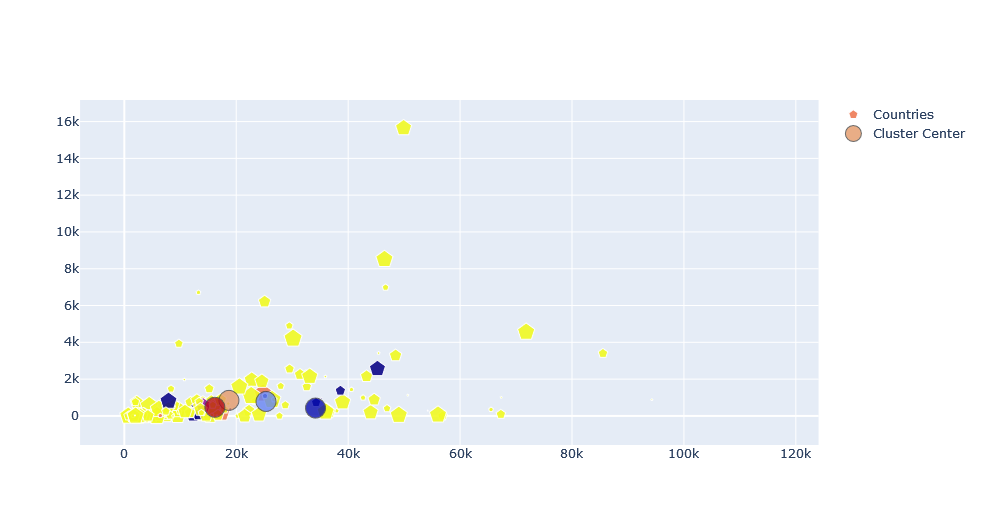
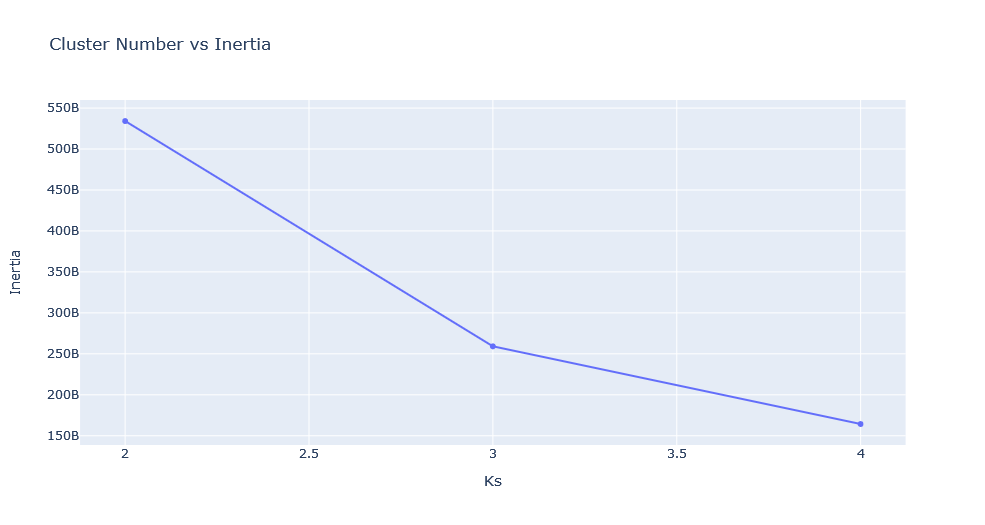
While choosing a best value of clusters or K, we should look into the last plot, an elbow curve. The best optimal value of K is the value from where our inertia starts to decrease slowly. Also, as we can see the colors of markers are not that cool which can be changed with below values. For that purpose, we will select a random color from the list of supported colors by plotly. Please follow this comment for more about it. A new Python file colors.py is created and below code is added on it. And we will use it later on.
import random
def get_colors():
    s='''
        aliceblue, antiquewhite, aqua, aquamarine, azure,
        beige, bisque, black, blanchedalmond, blue,
        blueviolet, brown, burlywood, cadetblue,
        chartreuse, chocolate, coral, cornflowerblue,
        cornsilk, crimson, cyan, darkblue, darkcyan,
        darkgoldenrod, darkgray, darkgrey, darkgreen,
        darkkhaki, darkmagenta, darkolivegreen, darkorange,
        darkorchid, darkred, darksalmon, darkseagreen,
        darkslateblue, darkslategray, darkslategrey,
        darkturquoise, darkviolet, deeppink, deepskyblue,
        dimgray, dimgrey, dodgerblue, firebrick,
        floralwhite, forestgreen, fuchsia, gainsboro,
        ghostwhite, gold, goldenrod, gray, grey, green,
        greenyellow, honeydew, hotpink, indianred, indigo,
        ivory, khaki, lavender, lavenderblush, lawngreen,
        lemonchiffon, lightblue, lightcoral, lightcyan,
        lightgoldenrodyellow, lightgray, lightgrey,
        lightgreen, lightpink, lightsalmon, lightseagreen,
        lightskyblue, lightslategray, lightslategrey,
        lightsteelblue, lightyellow, lime, limegreen,
        linen, magenta, maroon, mediumaquamarine,
        mediumblue, mediumorchid, mediumpurple,
        mediumseagreen, mediumslateblue, mediumspringgreen,
        mediumturquoise, mediumvioletred, midnightblue,
        mintcream, mistyrose, moccasin, navajowhite, navy,
        oldlace, olive, olivedrab, orange, orangered,
        orchid, palegoldenrod, palegreen, paleturquoise,
        palevioletred, papayawhip, peachpuff, peru, pink,
        plum, powderblue, purple, red, rosybrown,
        royalblue, saddlebrown, salmon, sandybrown,
        seagreen, seashell, sienna, silver, skyblue,
        slateblue, slategray, slategrey, snow, springgreen,
        steelblue, tan, teal, thistle, tomato, turquoise,
        violet, wheat, white, whitesmoke, yellow,
        yellowgreen
        '''
    li=s.split(',')
    li=[l.replace('\n','') for l in li]
    li=[l.replace(' ','') for l in li]
    random.shuffle(li)
    return li
Using PCA for Feature Reduction
We will have a separate blog about the PCA in future but right now, we will be using PCA with the purpose of dimensionality reduction of data.
from sklearn.decomposition import PCA
from sklearn.preprocessing import StandardScaler

# scale our data as z = (x - u) / s
ks=5
scaler = StandardScaler()
X_scaled = scaler.fit_transform(X)

# initialize PCA with components as 2 and fit it!
pca = PCA(n_components=2)
principalComponents = pca.fit_transform(X_scaled)
feat = list(range(pca.n_components_))

# using the new features given by PCA, create new DF and the use it in training purposes.
PCA_components = pd.DataFrame(principalComponents, columns=list(range(len(feat))))
choosed_component=[0,1]

inertias = []
for c in range(1,ks+1):
    X = PCA_components[choosed_component]

    model = KMeans(n_clusters=c)
    model.fit(X)
    y_kmeans = model.predict(X)
    vdf["cluster"] = y_kmeans
    inertias.append((c,model.inertia_))

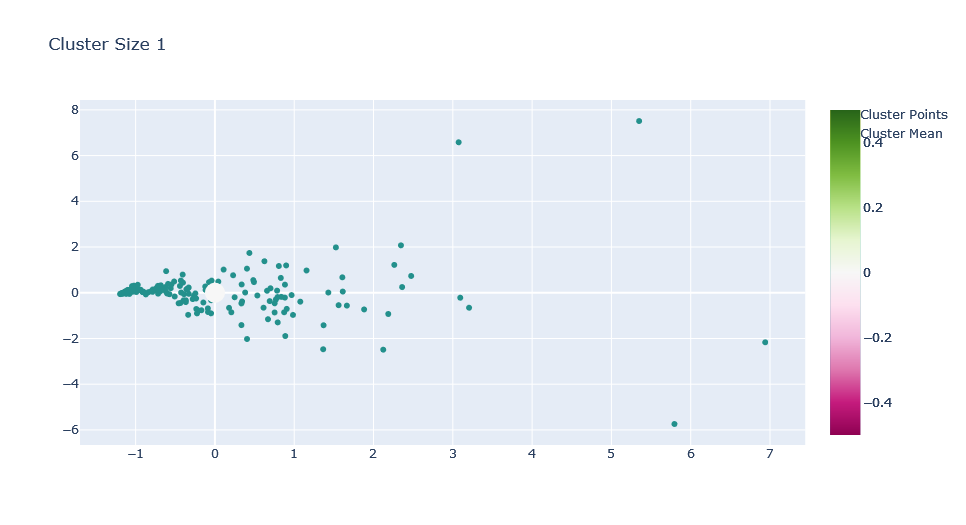
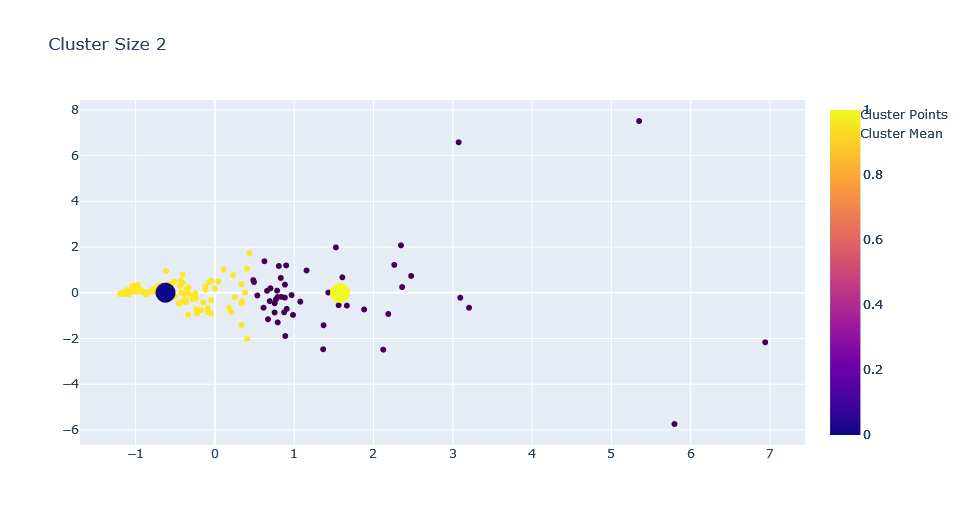
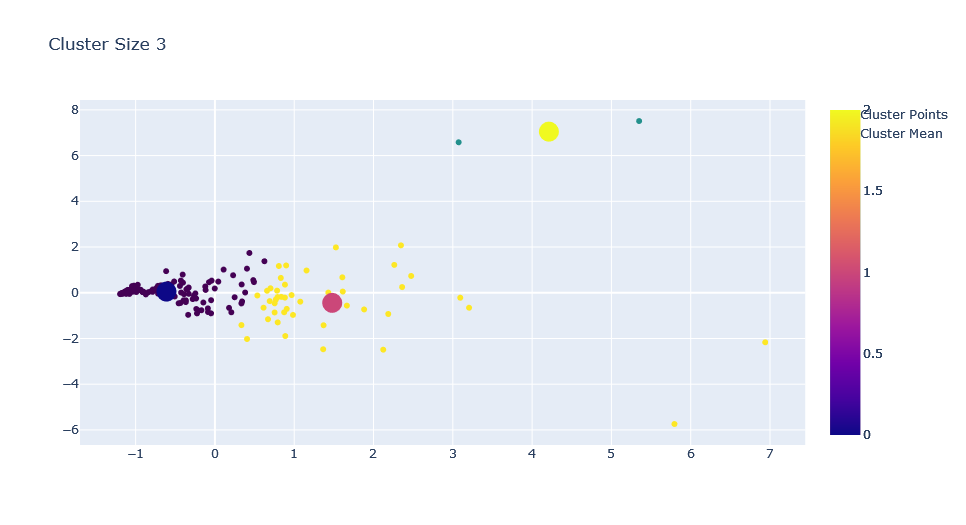
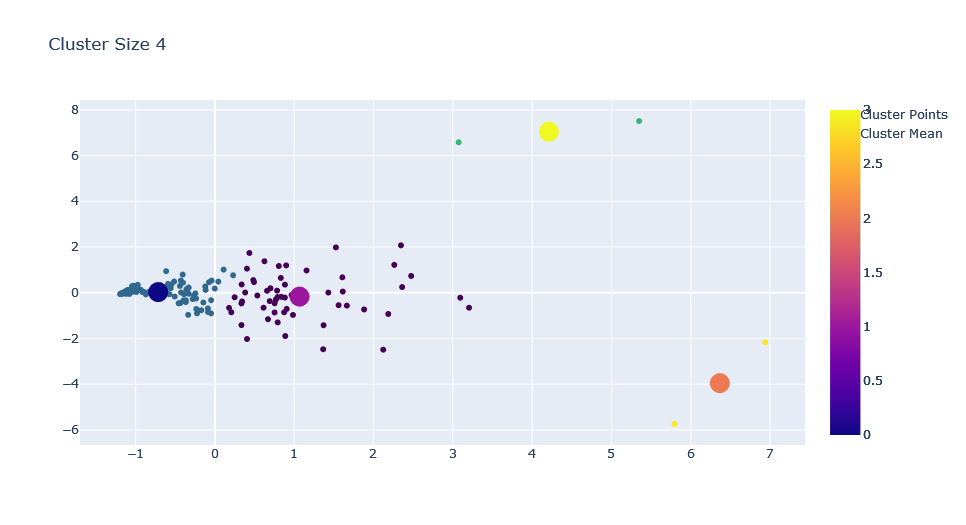
    trace0 = go.Scatter(x=X[0],y=X[1],mode='markers',  marker=dict(
        color=vdf.cluster,
        colorscale='Viridis',
        showscale=True
    ),name="Cluster Points")

    trace1 = go.Scatter(x=model.cluster_centers_[:, 0], y=model.cluster_centers_[:, 1],mode='markers', marker=dict(
        color=vdf.cluster.unique(),
        size=20,
        showscale=True
    ),name="Cluster Mean")

    data7 = go.Data([trace0, trace1])
    fig = go.Figure(data=data7)
    fig.update_layout(title=f"Cluster Size {c}")
    fig.show()

inertias=np.array(inertias).reshape(-1,2)
performance = go.Scatter(x=inertias[:,0], y=inertias[:,1])
layout = go.Layout(
    title="Cluster Number vs Inertia",
    xaxis=dict(
        title="Ks"
    ),
    yaxis=dict(
        title="Inertia"
    ) )
fig=go.Figure(data=go.Data([performance]))
fig.update_layout(layout)
fig.show()
Adding K Means on Streamlit App
Starting from previous streamlit code of ours, we will modify it to add new features.
- Import all required as before.
import streamlit as st
import numpy as np
import pandas as pd
import cufflinks
from plotly.subplots import make_subplots
import plotly.graph_objects as go
from sklearn_extra.cluster import KMedoids
from sklearn.cluster import KMeans
from sklearn.decomposition import PCA
from sklearn.preprocessing import StandardScaler
from colors import *
- Make a function to get data and call a get colors from previous function.
@st.cache
def get_data(url):
    df = pd.read_csv(url)
    df["date"] = pd.to_datetime(df.date).dt.date
    df['date'] = pd.DatetimeIndex(df.date)

    return df

colors = get_colors()
- Get data, prepare locations, prepare sidebar and show radio buttons to select mode of our APP, mode will be EDA and Clustering. We have already done EDA. We will also show current mode in main panel.
url = "https://covid.ourworldindata.org/data/owid-covid-data.csv"
data = get_data(url)
columns = ['total_cases', 'new_cases',
                'new_cases_smoothed', 'total_deaths', 'new_deaths',
                'new_deaths_smoothed', 'total_cases_per_million',
                'new_cases_per_million', 'new_cases_smoothed_per_million',
                'total_deaths_per_million', 'new_deaths_per_million',
                'new_deaths_smoothed_per_million', 'new_tests', 'total_tests',
                'total_tests_per_thousand', 'new_tests_per_thousand',
                'new_tests_smoothed', 'new_tests_smoothed_per_thousand',
                'tests_per_case', 'positive_rate', 'stringency_index',
                'population', 'population_density', 'median_age', 'aged_65_older',
                'aged_70_older', 'gdp_per_capita', 'extreme_poverty',
                'cardiovasc_death_rate', 'diabetes_prevalence', 'female_smokers',
                'male_smokers', 'handwashing_facilities', 'hospital_beds_per_thousand',
                'life_expectancy', 'human_development_index']

locations = data.location.unique().tolist()

sidebar = st.sidebar

mode = sidebar.radio("Mode", ["EDA", "Clustering"])
st.markdown("<h1 style='text-align: center; color: #ff0000;'>COVID-19</h1>", unsafe_allow_html=True)
st.markdown("# Mode: {}".format(mode), unsafe_allow_html=True)
- Put everything we have done in previous part inside a EDA mode.
if mode=="EDA":
    analysis_type = sidebar.radio("Analysis Type", ["Single", "Multiple"])
    st.markdown(f"# Analysis Mode: {analysis_type}")

    if analysis_type=="Single":
        location_selector = sidebar.selectbox(
            "Select a Location",
            locations
        )
        st.markdown(f"# Currently Selected {location_selector}")
        trend_level = sidebar.selectbox("Trend Level", ["Daily", "Weekly", "Monthly", "Quarterly", "Yearly"])
        st.markdown(f"### Currently Selected {trend_level}")

        show_data = sidebar.checkbox("Show Data")

        trend_kwds = {"Daily": "1D", "Weekly": "1W", "Monthly": "1M", "Quarterly": "1Q", "Yearly": "1Y"}
        trend_data = data.query(f"location=='{location_selector}'").\
            groupby(pd.Grouper(key="date",
            freq=trend_kwds[trend_level])).aggregate(new_cases=("new_cases", "sum"),
            new_deaths = ("new_deaths", "sum"),
            new_vaccinations = ("new_vaccinations", "sum"),
            new_tests = ("new_tests", "sum")).reset_index()

        trend_data["date"] = trend_data.date.dt.date

        new_cases = sidebar.checkbox("New Cases")
        new_deaths = sidebar.checkbox("New Deaths")
        new_vaccinations = sidebar.checkbox("New Vaccinations")
        new_tests = sidebar.checkbox("New Tests")

        lines = [new_cases, new_deaths, new_vaccinations, new_tests]
        line_cols = ["new_cases", "new_deaths", "new_vaccinations", "new_tests"]
        trends = [c[1] for c in zip(lines,line_cols) if c[0]==True]


        if show_data:
            tcols = ["date"] + trends
            st.dataframe(trend_data[tcols])

        subplots=sidebar.checkbox("Show Subplots", True)
        if len(trends)>0:
            fig=trend_data.iplot(kind="line", asFigure=True, xTitle="Date", yTitle="Values",
                                x="date", y=trends, title=f"{trend_level} Trend of {', '.join(trends)}.", subplots=subplots)
            st.plotly_chart(fig, use_container_width=False)

    if analysis_type=="Multiple":
        selected = sidebar.multiselect("Select Locations ", locations)
        st.markdown(f"## Selected Locations: {', '.join(selected)}")
        show_data = sidebar.checkbox("Show Data")
        trend_level = sidebar.selectbox("Trend Level", ["Daily", "Weekly", "Monthly", "Quarterly", "Yearly"])
        st.markdown(f"### Currently Selected {trend_level}")

        trend_kwds = {"Daily": "1D", "Weekly": "1W", "Monthly": "1M", "Quarterly": "1Q", "Yearly": "1Y"}

        trend_data = data.query(f"location in {selected}").\
            groupby(["location", pd.Grouper(key="date",
            freq=trend_kwds[trend_level])]).aggregate(new_cases=("new_cases", "sum"),
            new_deaths = ("new_deaths", "sum"),
            new_vaccinations = ("new_vaccinations", "sum"),
            new_tests = ("new_tests", "sum")).reset_index()

        trend_data["date"] = trend_data.date.dt.date

        new_cases = sidebar.checkbox("New Cases")
        new_deaths = sidebar.checkbox("New Deaths")
        new_vaccinations = sidebar.checkbox("New Vaccinations")
        new_tests = sidebar.checkbox("New Tests")

        lines = [new_cases, new_deaths, new_vaccinations, new_tests]
        line_cols = ["new_cases", "new_deaths", "new_vaccinations", "new_tests"]
        trends = [c[1] for c in zip(lines,line_cols) if c[0]==True]

        ndf = pd.DataFrame(data=trend_data.date.unique(),columns=["date"])

        for s in selected:
            new_cols = ["date"]+[f"{s}_{c}" for c in line_cols]
            tdf = trend_data.query(f"location=='{s}'")
            tdf.drop("location", axis=1, inplace=True)
            tdf.columns=new_cols
            ndf=ndf.merge(tdf,on="date",how="inner")

        if show_data:
            if len(ndf)>0:
                st.dataframe(ndf)
            else:
                st.markdown("Empty Dataframe")

        new_trends = []
        for c in trends:
            new_trends.extend([f"{s}_{c}" for s in selected])

        subplots=sidebar.checkbox("Show Subplots", True)
        if len(trends)>0:
            st.markdown("### Trend of Selected Locations")

            fig=ndf.iplot(kind="line", asFigure=True, xTitle="Date", yTitle="Values",
                                x="date", y=new_trends, title=f"{trend_level} Trend of {', '.join(trends)}.", subplots=subplots)
            st.plotly_chart(fig, use_container_width=False)
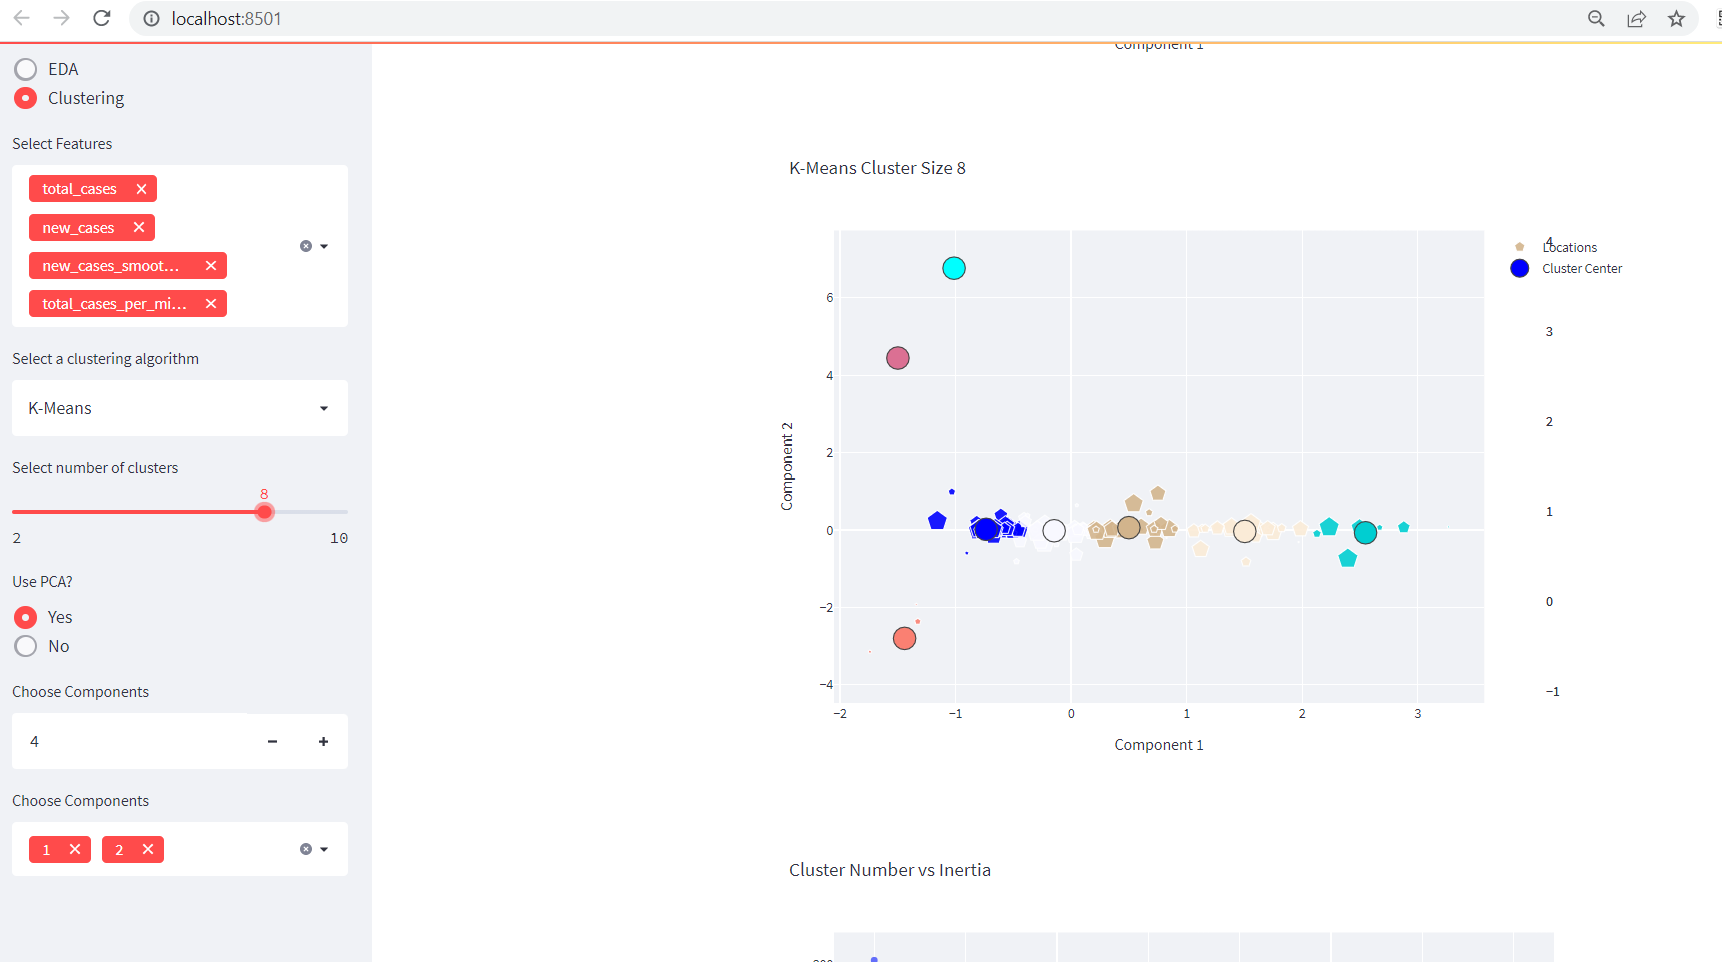
- For Clustering mode, first select features from our predefined columns list. Please follow comment line above the code on below section. Most of the parts are already done on above steps.
if mode=="Clustering":
    features = sidebar.multiselect("Select Features", columns, default=columns[:3])

    # select a  clustering algorithm
    calg = sidebar.selectbox("Select a clustering algorithm", ["K-Means","K-Medoids", "Spectral Clustering", "Agglomerative Clustering"])

    # select number of clusters
    ks = sidebar.slider("Select number of clusters", min_value=2, max_value=10, value=2)

    # select a dataframe to apply cluster on

    udf = data.sort_values("date").drop_duplicates(subset=["location"],keep="last").dropna(subset=features)
    udf = udf[~udf.location.isin(["Lower middle income", "North America", "World", "Asia", "Europe",
                           "European Union", "Upper middle income",
                           "High income", "South America"])]

    # udf[features].dropna()

    if len(features)>=2:

        if calg == "K-Means":
            st.markdown("### K-Means Clustering")
            use_pca = sidebar.radio("Use PCA?",["Yes","No"])
            if use_pca=="No":
                st.markdown("### Not Using PCA")
                inertias = []
                for c in range(1,ks+1):
                    tdf = udf.copy()
                    X = tdf[features]
                    # colors=['red','green','blue','magenta','black','yellow']
                    model = KMeans(n_clusters=c)
                    model.fit(X)
                    y_kmeans = model.predict(X)
                    tdf["cluster"] = y_kmeans
                    inertias.append((c,model.inertia_))

                    trace0 = go.Scatter(x=tdf[features[0]],y=tdf[features[1]],mode='markers',
                                        marker=dict(
                                                color=tdf.cluster.apply(lambda x: colors[x]),
                                                colorscale='Viridis',
                                                showscale=True,
                                                size = udf["total_cases"]%20,
                                                opacity = 0.9,
                                                reversescale = True,
                                                symbol = 'pentagon'
                                                ),
                                        name="Locations", text=udf["location"])

                    trace1 = go.Scatter(x=model.cluster_centers_[:, 0], y=model.cluster_centers_[:, 1],
                                        mode='markers',
                                        marker=dict(
                                            color=colors,
                                            size=20,
                                            symbol="circle",
                                            showscale=True,
                                            line = dict(
                                                width=1,
                                                color='rgba(102, 102, 102)'
                                                )

                                            ),
                                        name="Cluster Mean")

                    data7 = go.Data([trace0, trace1])
                    fig = go.Figure(data=data7)
                    layout = go.Layout(
                                height=600, width=800, title=f"KMeans Cluster Size {c}",
                                xaxis=dict(
                                    title=features[0],
                                ),
                                yaxis=dict(
                                    title=features[1]
                                ) )

                    fig.update_layout(layout)
                    st.plotly_chart(fig)

                inertias=np.array(inertias).reshape(-1,2)
                performance = go.Scatter(x=inertias[:,0], y=inertias[:,1])
                layout = go.Layout(
                    title="Cluster Number vs Inertia",
                    xaxis=dict(
                        title="Ks"
                    ),
                    yaxis=dict(
                        title="Inertia"
                    ) )
                fig=go.Figure(data=go.Data([performance]))
                fig.update_layout(layout)
                st.plotly_chart(fig)

            if use_pca=="Yes":
                st.markdown("### Using PCA")
                comp = sidebar.number_input("Choose Components",1,10,3)

                tdf=udf.copy()

                X = udf[features]
                scaler = StandardScaler()
                X_scaled = scaler.fit_transform(X)

                pca = PCA(n_components=int(comp))
                principalComponents = pca.fit_transform(X_scaled)
                feat = list(range(pca.n_components_))
                PCA_components = pd.DataFrame(principalComponents, columns=list(range(len(feat))))
                choosed_component = sidebar.multiselect("Choose Components",feat,default=[1,2])
                choosed_component=[int(i) for i in choosed_component]
                inertias = []
                if len(choosed_component)>1:
                    for c in range(1,ks+1):
                        X = PCA_components[choosed_component]

                        model = KMeans(n_clusters=c)
                        model.fit(X)
                        y_kmeans = model.predict(X)
                        tdf["cluster"] = y_kmeans
                        inertias.append((c,model.inertia_))

                        trace0 = go.Scatter(x=X[choosed_component[0]],y=X[choosed_component[1]],mode='markers',
                                            marker=dict(
                                                    color=tdf.cluster.apply(lambda x: colors[x]),
                                                    colorscale='Viridis',
                                                    showscale=True,
                                                    size = udf["total_cases"]%20,
                                                    opacity = 0.9,
                                                    reversescale = True,
                                                    symbol = 'pentagon'
                                                    ),
                                            name="Locations", text=udf["location"])

                        trace1 = go.Scatter(x=model.cluster_centers_[:, 0], y=model.cluster_centers_[:, 1],
                                            mode='markers',
                                            marker=dict(
                                                color=colors,
                                                size=20,
                                                symbol="circle",
                                                showscale=True,
                                                line = dict(
                                                    width=1,
                                                    color='rgba(102, 102, 102)'
                                                    )

                                                ),
                                            name="Cluster Mean")


                        data7 = go.Data([trace0, trace1])
                        fig = go.Figure(data=data7)

                        layout = go.Layout(
                                    height=600, width=800, title=f"KMeans Cluster Size {c}",
                                    xaxis=dict(
                                        title=f"Component {choosed_component[0]}",
                                    ),
                                    yaxis=dict(
                                        title=f"Component {choosed_component[1]}"
                                    ) )
                        fig.update_layout(layout)
                        st.plotly_chart(fig)

                    inertias=np.array(inertias).reshape(-1,2)
                    performance = go.Scatter(x=inertias[:,0], y=inertias[:,1])
                    layout = go.Layout(
                        title="Cluster Number vs Inertia",
                        xaxis=dict(
                            title="Ks"
                        ),
                        yaxis=dict(
                            title="Inertia"
                        ) )
                    fig=go.Figure(data=go.Data([performance]))
                    fig.update_layout(layout)
                    st.plotly_chart(fig)
    else:
        st.markdown("### Please Select at Least 2 Features for Visualization.")
We should be seeing something like below on our APP:
K Medoids Clustering
K-medoids are a prominent clustering algorithm as an improvement of the predecessor, K-Means algorithm. Despite its widely used and less sensitive to noises and outliers, the performance of K-medoids clustering algorithm is affected by the distance function. From here.
When k-means algorithm is not appropriate to make a objects of cluster to the data points then k-medoid clustering algorithm is prefer. The medoid is objects of cluster whose dissimilarity to all the objects in the cluster is minimum. The main difference between K-means and K-medoid algorithm that we work with arbitrary matrix of distance instead of euclidean distance. K-medoid is a classical partitioning technique of clustering that cluster the dataset into k cluster. It is more robust to noise and outliers because it may minimize sum of pair-wise dissimilarities however k-means minimize sum of squared Euclidean distances. Most common distances used in KMedoids clustering techniques are Manhattan distance or Minkowski distance and here we will use Manhattan distance.
Manhattan Distance
| Of p1, p2 is: $$ | (x2-x1)+(y2-y1) | $$. |
Algorithm
- Step 1: Randomly select(without replacement) k of the n data points as the median.
- Step 2: Associate each data points to the closest median.
- Step 3: While the cost of the configuration decreases:
- For each medoid
m, for each non-medoid data pointo:- Swap
mando, re-compute the cost. - If the total cost of the configuration increased in the previous step, undo the swap.
- Swap
- For each medoid
We will use scikit learn extra instead of scikit learn this provides more features of algorithms than sklearn. But there is huge problem with KMedoids which is the time and memory complexity. We will be looping through data in big O. So we will try to cluster on sample data instead of the original data.
pip install sklearn-extra
Everything will be as we have done for the KMeans, thus we will skip its exploration here and directly insert it in App.
KMedoids to Streamlit App
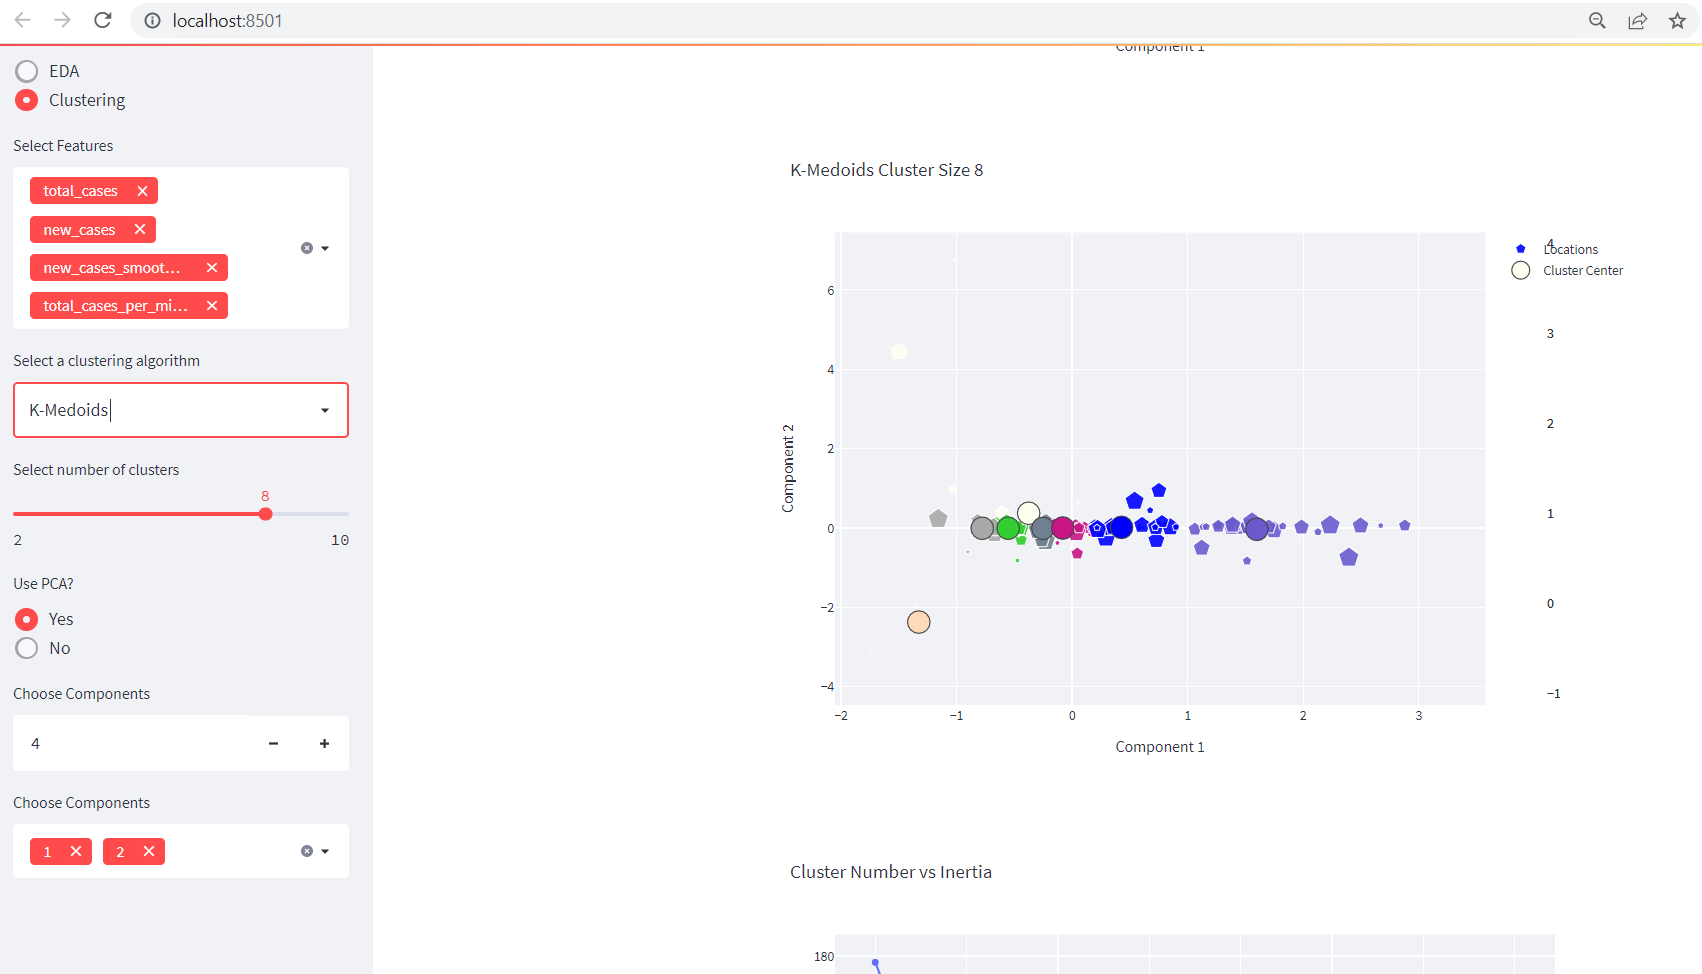
To use KMedoids, we should import KMedoids as from sklearn_extra.cluster import KMedoids. Then everything is similar to the KMeans.
        # if selected kmedoids, do respective operations
        if calg == "K-Medoids":
            st.markdown("### K-Medoids Clustering")

            # if using PCA or not
            use_pca = sidebar.radio("Use PCA?",["Yes","No"])
            # if not using pca, do default clustering
            if use_pca=="No":
                st.markdown("### Not Using PCA")
                inertias = []
                for c in range(1,ks+1):
                    tdf = udf.copy()
                    X = tdf[features]
                    # colors=['red','green','blue','magenta','black','yellow']
                    model = KMedoids(n_clusters=c)
                    model.fit(X)
                    y_kmeans = model.predict(X)
                    tdf["cluster"] = y_kmeans
                    inertias.append((c,model.inertia_))


                    trace0 = go.Scatter(x=tdf[features[0]],y=tdf[features[1]],mode='markers',
                                        marker=dict(
                                                color=tdf.cluster.apply(lambda x: colors[x]),
                                                colorscale='Viridis',
                                                showscale=True,
                                                size = udf["total_cases"]%20,
                                                opacity = 0.9,
                                                reversescale = True,
                                                symbol = 'pentagon'
                                                ),
                                        name="Locations", text=udf["location"])

                    trace1 = go.Scatter(x=model.cluster_centers_[:, 0], y=model.cluster_centers_[:, 1],
                                        mode='markers',
                                        marker=dict(
                                            color=colors,
                                            size=20,
                                            symbol="circle",
                                            showscale=True,
                                            line = dict(
                                                width=1,
                                                color='rgba(102, 102, 102)'
                                                )

                                            ),
                                        name="Cluster Mean")

                    data7 = go.Data([trace0, trace1])
                    fig = go.Figure(data=data7)
                    layout = go.Layout(
                                height=600, width=800, title=f"KMedoids Cluster Size {c}",
                                xaxis=dict(
                                    title=features[0],
                                ),
                                yaxis=dict(
                                    title=features[1]
                                ) )

                    fig.update_layout(layout)
                    st.plotly_chart(fig)

                inertias=np.array(inertias).reshape(-1,2)
                performance = go.Scatter(x=inertias[:,0], y=inertias[:,1])
                layout = go.Layout(
                    title="Cluster Number vs Inertia",
                    xaxis=dict(
                        title="Ks"
                    ),
                    yaxis=dict(
                        title="Inertia"
                    ) )
                fig=go.Figure(data=go.Data([performance]))
                fig.update_layout(layout)
                st.plotly_chart(fig)

            # if using pca, use pca to reduce dimensionality and then do clustering
            if use_pca=="Yes":
                st.markdown("### Using PCA")
                comp = sidebar.number_input("Choose Components",1,10,3)

                tdf=udf.copy()

                X = udf[features]
                scaler = StandardScaler()
                X_scaled = scaler.fit_transform(X)

                pca = PCA(n_components=int(comp))
                principalComponents = pca.fit_transform(X_scaled)
                feat = list(range(pca.n_components_))
                PCA_components = pd.DataFrame(principalComponents, columns=list(range(len(feat))))
                choosed_component = sidebar.multiselect("Choose Components",feat,default=[1,2])
                choosed_component=[int(i) for i in choosed_component]
                inertias = []
                if len(choosed_component)>1:
                    for c in range(1,ks+1):
                        X = PCA_components[choosed_component]

                        model = KMedoids(n_clusters=c)
                        model.fit(X)
                        y_kmeans = model.predict(X)
                        tdf["cluster"] = y_kmeans
                        inertias.append((c,model.inertia_))

                        trace0 = go.Scatter(x=X[choosed_component[0]],y=X[choosed_component[1]],mode='markers',
                                            marker=dict(
                                                    color=tdf.cluster.apply(lambda x: colors[x]),
                                                    colorscale='Viridis',
                                                    showscale=True,
                                                    size = udf["total_cases"]%20,
                                                    opacity = 0.9,
                                                    reversescale = True,
                                                    symbol = 'pentagon'
                                                    ),
                                            name="Locations", text=udf["location"])

                        trace1 = go.Scatter(x=model.cluster_centers_[:, 0], y=model.cluster_centers_[:, 1],
                                            mode='markers',
                                            marker=dict(
                                                color=colors,
                                                size=20,
                                                symbol="circle",
                                                showscale=True,
                                                line = dict(
                                                    width=1,
                                                    color='rgba(102, 102, 102)'
                                                    )

                                                ),
                                            name="Cluster Median")


                        data7 = go.Data([trace0, trace1])
                        fig = go.Figure(data=data7)

                        layout = go.Layout(
                                    height=600, width=800, title=f"KMedoids Cluster Size {c}",
                                    xaxis=dict(
                                        title=f"Component {choosed_component[0]}",
                                    ),
                                    yaxis=dict(
                                        title=f"Component {choosed_component[1]}"
                                    ) )
                        fig.update_layout(layout)
                        st.plotly_chart(fig)

                    inertias=np.array(inertias).reshape(-1,2)
                    performance = go.Scatter(x=inertias[:,0], y=inertias[:,1])
                    layout = go.Layout(
                        title="Cluster Number vs Inertia",
                        xaxis=dict(
                            title="Ks"
                        ),
                        yaxis=dict(
                            title="Inertia"
                        ) )
                    fig=go.Figure(data=go.Data([performance]))
                    fig.update_layout(layout)
                    st.plotly_chart(fig)
We should be seeing something like below:
Making it little bit dynamic
We could do this by making a class with respect to the selected value of calg and we do not need to have if/else to make a clustering class.
import streamlit as st
import numpy as np
import pandas as pd
import cufflinks
from plotly.subplots import make_subplots
import plotly.graph_objects as go
from sklearn_extra.cluster import KMedoids
from sklearn.cluster import KMeans
from sklearn.decomposition import PCA
from sklearn.preprocessing import StandardScaler
from colors import *

@st.cache
def get_data(url):
    df = pd.read_csv("owid-covid-data.csv")
    df["date"] = pd.to_datetime(df.date).dt.date
    df['date'] = pd.DatetimeIndex(df.date)

    return df

colors = get_colors()

url = "https://covid.ourworldindata.org/data/owid-covid-data.csv"
data = get_data(url)
columns = ['total_cases', 'new_cases',
                'new_cases_smoothed', 'total_deaths', 'new_deaths',
                'new_deaths_smoothed', 'total_cases_per_million',
                'new_cases_per_million', 'new_cases_smoothed_per_million',
                'total_deaths_per_million', 'new_deaths_per_million',
                'new_deaths_smoothed_per_million', 'new_tests', 'total_tests',
                'total_tests_per_thousand', 'new_tests_per_thousand',
                'new_tests_smoothed', 'new_tests_smoothed_per_thousand',
                'tests_per_case', 'positive_rate', 'stringency_index',
                'population', 'population_density', 'median_age', 'aged_65_older',
                'aged_70_older', 'gdp_per_capita', 'extreme_poverty',
                'cardiovasc_death_rate', 'diabetes_prevalence', 'female_smokers',
                'male_smokers', 'handwashing_facilities', 'hospital_beds_per_thousand',
                'life_expectancy', 'human_development_index']

locations = data.location.unique().tolist()

sidebar = st.sidebar

mode = sidebar.radio("Mode", ["EDA", "Clustering"])
st.markdown("<h1 style='text-align: center; color: #ff0000;'>COVID-19</h1>", unsafe_allow_html=True)
st.markdown("# Mode: {}".format(mode), unsafe_allow_html=True)

if mode=="EDA":
    analysis_type = sidebar.radio("Analysis Type", ["Single", "Multiple"])
    st.markdown(f"# Analysis Mode: {analysis_type}")

    if analysis_type=="Single":
        location_selector = sidebar.selectbox(
            "Select a Location",
            locations
        )
        st.markdown(f"# Currently Selected {location_selector}")
        trend_level = sidebar.selectbox("Trend Level", ["Daily", "Weekly", "Monthly", "Quarterly", "Yearly"])
        st.markdown(f"### Currently Selected {trend_level}")

        show_data = sidebar.checkbox("Show Data")

        trend_kwds = {"Daily": "1D", "Weekly": "1W", "Monthly": "1M", "Quarterly": "1Q", "Yearly": "1Y"}
        trend_data = data.query(f"location=='{location_selector}'").\
            groupby(pd.Grouper(key="date",
            freq=trend_kwds[trend_level])).aggregate(new_cases=("new_cases", "sum"),
            new_deaths = ("new_deaths", "sum"),
            new_vaccinations = ("new_vaccinations", "sum"),
            new_tests = ("new_tests", "sum")).reset_index()

        trend_data["date"] = trend_data.date.dt.date

        new_cases = sidebar.checkbox("New Cases")
        new_deaths = sidebar.checkbox("New Deaths")
        new_vaccinations = sidebar.checkbox("New Vaccinations")
        new_tests = sidebar.checkbox("New Tests")

        lines = [new_cases, new_deaths, new_vaccinations, new_tests]
        line_cols = ["new_cases", "new_deaths", "new_vaccinations", "new_tests"]
        trends = [c[1] for c in zip(lines,line_cols) if c[0]==True]


        if show_data:
            tcols = ["date"] + trends
            st.dataframe(trend_data[tcols])

        subplots=sidebar.checkbox("Show Subplots", True)
        if len(trends)>0:
            fig=trend_data.iplot(kind="line", asFigure=True, xTitle="Date", yTitle="Values",
                                x="date", y=trends, title=f"{trend_level} Trend of {', '.join(trends)}.", subplots=subplots)
            st.plotly_chart(fig, use_container_width=False)

    if analysis_type=="Multiple":
        selected = sidebar.multiselect("Select Locations ", locations)
        st.markdown(f"## Selected Locations: {', '.join(selected)}")
        show_data = sidebar.checkbox("Show Data")
        trend_level = sidebar.selectbox("Trend Level", ["Daily", "Weekly", "Monthly", "Quarterly", "Yearly"])
        st.markdown(f"### Currently Selected {trend_level}")

        trend_kwds = {"Daily": "1D", "Weekly": "1W", "Monthly": "1M", "Quarterly": "1Q", "Yearly": "1Y"}

        trend_data = data.query(f"location in {selected}").\
            groupby(["location", pd.Grouper(key="date",
            freq=trend_kwds[trend_level])]).aggregate(new_cases=("new_cases", "sum"),
            new_deaths = ("new_deaths", "sum"),
            new_vaccinations = ("new_vaccinations", "sum"),
            new_tests = ("new_tests", "sum")).reset_index()

        trend_data["date"] = trend_data.date.dt.date

        new_cases = sidebar.checkbox("New Cases")
        new_deaths = sidebar.checkbox("New Deaths")
        new_vaccinations = sidebar.checkbox("New Vaccinations")
        new_tests = sidebar.checkbox("New Tests")

        lines = [new_cases, new_deaths, new_vaccinations, new_tests]
        line_cols = ["new_cases", "new_deaths", "new_vaccinations", "new_tests"]
        trends = [c[1] for c in zip(lines,line_cols) if c[0]==True]

        ndf = pd.DataFrame(data=trend_data.date.unique(),columns=["date"])

        for s in selected:
            new_cols = ["date"]+[f"{s}_{c}" for c in line_cols]
            tdf = trend_data.query(f"location=='{s}'")
            tdf.drop("location", axis=1, inplace=True)
            tdf.columns=new_cols
            ndf=ndf.merge(tdf,on="date",how="inner")

        if show_data:
            if len(ndf)>0:
                st.dataframe(ndf)
            else:
                st.markdown("Empty Dataframe")

        new_trends = []
        for c in trends:
            new_trends.extend([f"{s}_{c}" for s in selected])

        subplots=sidebar.checkbox("Show Subplots", True)
        if len(trends)>0:
            st.markdown("### Trend of Selected Locations")

            fig=ndf.iplot(kind="line", asFigure=True, xTitle="Date", yTitle="Values",
                                x="date", y=new_trends, title=f"{trend_level} Trend of {', '.join(trends)}.", subplots=subplots)
            st.plotly_chart(fig, use_container_width=False)

elif mode=="Clustering":
    colors = get_colors()
    features = sidebar.multiselect("Select Features", columns, default=columns[:3])

    # select a  clustering algorithm
    calg = sidebar.selectbox("Select a clustering algorithm", ["K-Means","K-Medoids"])
    algs = {"K-Means": KMeans, "K-Medoids": KMedoids}

    # select number of clusters
    ks = sidebar.slider("Select number of clusters", min_value=2, max_value=10, value=2)

    # select a dataframe to apply cluster on

    udf = data.sort_values("date").drop_duplicates(subset=["location"],keep="last").dropna(subset=features)
    udf = udf[~udf.location.isin(["Lower middle income", "North America", "World", "Asia", "Europe",
                           "European Union", "Upper middle income",
                           "High income", "South America"])]

    # udf[features].dropna()

    if len(features)>=2:
        st.markdown(f"### {calg} Clustering")

        # if using PCA or not
        use_pca = sidebar.radio("Use PCA?",["Yes","No"])
        # if not using pca, do default clustering
        if use_pca=="No":
            st.markdown("### Not Using PCA")
            inertias = []
            for c in range(1,ks+1):
                tdf = udf.copy()
                X = tdf[features]
                # colors=['red','green','blue','magenta','black','yellow']
                model = algs[calg](n_clusters=c)
                model.fit(X)
                y_kmeans = model.predict(X)
                tdf["cluster"] = y_kmeans
                inertias.append((c,model.inertia_))


                trace0 = go.Scatter(x=tdf[features[0]],y=tdf[features[1]],mode='markers',
                                    marker=dict(
                                            color=tdf.cluster.apply(lambda x: colors[x]),
                                            colorscale='Viridis',
                                            showscale=True,
                                            size = udf["total_cases"]%20,
                                            opacity = 0.9,
                                            reversescale = True,
                                            symbol = 'pentagon'
                                            ),
                                    name="Locations", text=udf["location"])

                trace1 = go.Scatter(x=model.cluster_centers_[:, 0], y=model.cluster_centers_[:, 1],
                                    mode='markers',
                                    marker=dict(
                                        color=colors,
                                        size=20,
                                        symbol="circle",
                                        showscale=True,
                                        line = dict(
                                            width=1,
                                            color='rgba(102, 102, 102)'
                                            )

                                        ),
                                    name="Cluster Center")

                data7 = go.Data([trace0, trace1])
                fig = go.Figure(data=data7)
                layout = go.Layout(
                            height=600, width=800, title=f"{calg} Cluster Size {c}",
                            xaxis=dict(
                                title=features[0],
                            ),
                            yaxis=dict(
                                title=features[1]
                            ) )

                fig.update_layout(layout)
                st.plotly_chart(fig)

            inertias=np.array(inertias).reshape(-1,2)
            performance = go.Scatter(x=inertias[:,0], y=inertias[:,1])
            layout = go.Layout(
                title="Cluster Number vs Inertia",
                xaxis=dict(
                    title="Ks"
                ),
                yaxis=dict(
                    title="Inertia"
                ) )
            fig=go.Figure(data=go.Data([performance]))
            fig.update_layout(layout)
            st.plotly_chart(fig)

        # if using pca, use pca to reduce dimensionality and then do clustering
        if use_pca=="Yes":
            st.markdown("### Using PCA")
            comp = sidebar.number_input("Choose Components",1,10,3)

            tdf=udf.copy()

            X = udf[features]
            scaler = StandardScaler()
            X_scaled = scaler.fit_transform(X)

            pca = PCA(n_components=int(comp))
            principalComponents = pca.fit_transform(X_scaled)
            feat = list(range(pca.n_components_))
            PCA_components = pd.DataFrame(principalComponents, columns=list(range(len(feat))))
            choosed_component = sidebar.multiselect("Choose Components",feat,default=[1,2])
            choosed_component=[int(i) for i in choosed_component]
            inertias = []
            if len(choosed_component)>1:
                for c in range(1,ks+1):
                    X = PCA_components[choosed_component]

                    model = algs[calg](n_clusters=c)
                    model.fit(X)
                    y_kmeans = model.predict(X)
                    tdf["cluster"] = y_kmeans
                    inertias.append((c,model.inertia_))

                    trace0 = go.Scatter(x=X[choosed_component[0]],y=X[choosed_component[1]],mode='markers',
                                        marker=dict(
                                                color=tdf.cluster.apply(lambda x: colors[x]),
                                                colorscale='Viridis',
                                                showscale=True,
                                                size = udf["total_cases"]%20,
                                                opacity = 0.9,
                                                reversescale = True,
                                                symbol = 'pentagon'
                                                ),
                                        name="Locations", text=udf["location"])

                    trace1 = go.Scatter(x=model.cluster_centers_[:, 0], y=model.cluster_centers_[:, 1],
                                        mode='markers',
                                        marker=dict(
                                            color=colors,
                                            size=20,
                                            symbol="circle",
                                            showscale=True,
                                            line = dict(
                                                width=1,
                                                color='rgba(102, 102, 102)'
                                                )

                                            ),
                                        name="Cluster Center")


                    data7 = go.Data([trace0, trace1])
                    fig = go.Figure(data=data7)

                    layout = go.Layout(
                                height=600, width=800, title=f"{calg} Cluster Size {c}",
                                xaxis=dict(
                                    title=f"Component {choosed_component[0]}",
                                ),
                                yaxis=dict(
                                    title=f"Component {choosed_component[1]}"
                                ) )
                    fig.update_layout(layout)
                    st.plotly_chart(fig)

                inertias=np.array(inertias).reshape(-1,2)
                performance = go.Scatter(x=inertias[:,0], y=inertias[:,1])
                layout = go.Layout(
                    title="Cluster Number vs Inertia",
                    xaxis=dict(
                        title="Ks"
                    ),
                    yaxis=dict(
                        title="Inertia"
                    ) )
                fig=go.Figure(data=go.Data([performance]))
                fig.update_layout(layout)
                st.plotly_chart(fig)


    else:
        st.markdown("### Please Select at Least 2 Features for Visualization.")
This is all for this part, now in the next part, we will add regression feature to our APP.


Comments